| Fire incidents reported |
|---|
| Sreet name | Count |
|---|
| FIFER HEIGHTS | 12 | | HWY 101 NORTH | 12 | | LEWIS CLARK ROAD | 12 | | PACIFIC WAY | 12 | | MARION AVE | 10 | | MARION AVE | 10 | | OCEAN AVE | 10 | | PACIFIC WAY | 10 | | COTTAGE AVE | 8 | | HWY 101 | 8 | | HWY 101 HWY | 8 | | HWY 101 SOUTH | 8 | | 101 HWY | 6 | | G STREET | 6 | | MARION | 6 | | MCCORMICK GARDENS | 6 | | MCCORMICK GARDENS RD | 6 | | OCEAN | 6 | | ANDERSON RD | 4 | | COTTAGE | 4 | | DEL RAY BEACH ACCESS | 4 | | EAST PINE DR | 4 | | G ST | 4 | | HWY 101 N | 4 | | NEACOXIE BLVD | 4 |
| | | Fire incidents reported |
|---|
| Sreet name | Count |
|---|
| OCEAN COURT | 4 | | OCEAN CT | 4 | | PACIFIC WAY BEACH TRAIL | 4 | | WAKEMAN LANE | 4 | | "D" STREET | 2 | | "G" STREET | 2 | | 1/2 MILE NORTH 10TH STREET ACC | 2 | | 10TH STREET BEACH ACCESS | 2 | | 13TH STREET | 2 | | 1ST ST | 2 | | 202 HWY | 2 | | 400 BLOCK WEST IN DUNES | 2 | | 5TH STREET | 2 | | ADAIR LANE | 2 | | ADAIR LN | 2 | | APPROX 1 4 MILE NORTH 10TH ST | 2 | | BAILEY LANE | 2 | | BEACH ACCESS PACIFIC WAY | 2 | | BENEKE CREEK RD | 2 | | BENEKECREEK | 2 | | BLUE HERION | 2 | | BLUE HERON ROAD | 2 | | C ST | 2 | | CARISM DR | 2 | | |
|
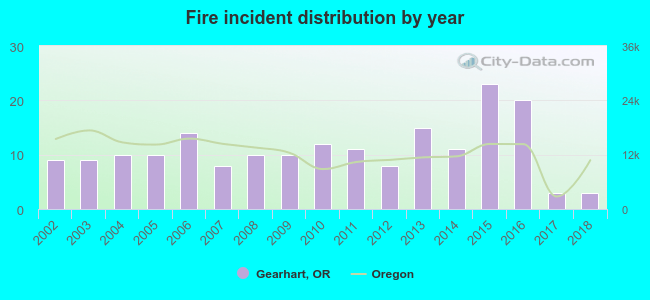 According to the data from the years 2002 - 2018 the average number of fires per year is 11. The highest number of fire incidents - 23 took place in 2015, and the least - 3 in 2017. The data has a declining trend.
 32.3% incidents where reported in the morning and 67.7% in the evening. The most fires (18.8%) took place on Sunday, and the least (10.2%) on Friday.
 Based on the 186 fire incident reports from years 2002 - 2018 most fires (19.4%) took place during July, and the least (3.8%) in October.
 Out of all 909 cases reported during the years 2002 - 2018, the most belonged to the categories: Rescue & EMS (51.0%), Fire (20.5%), and Hazardous Condition (11.7%).
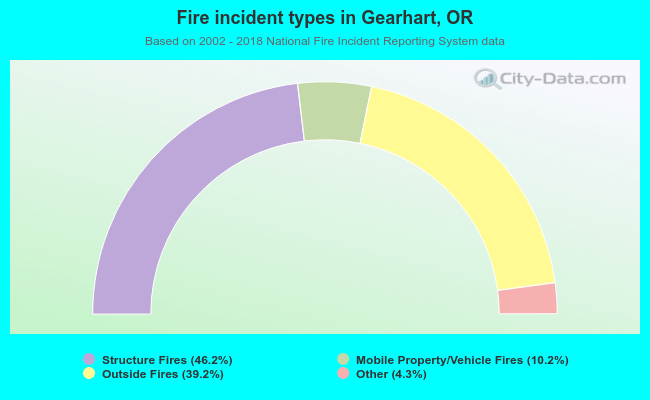 When looking into fire subcategories, the most incidents belonged to: Structure Fires (46.2%), and Outside Fires (39.2%).