Geneseo: Fire Incidents, Illinois (IL)
Where are fire incidents reported in Geneseo, IL
Something went wrong! Please refresh the page.
|
| |||||||||||||||||||||||||||||||||||||||||||||||||||||||||||||||||||||||||||||||||||||||||||||||||||||||||||||
2002 - 2018 National Fire Incident Reporting System (NFIRS) incidents
- Incident types reported to NFIRS in Geneseo, IL
- 72441.9%Hazardous Condition
- 50529.2%Fire
- 22312.9%Rescue & EMS
- 1337.7%False Alarm
- 714.1%Service Call
- 623.6%Good Intent Call
- 90.5%Severe Weather
- 20.1%Overpressure Rupture
- Fire incident types reported to NFIRS in Geneseo, IL
- 23947.3%Outside Fires
- 16632.9%Structure Fires
- 9418.6%Mobile Property/Vehicle Fires
- 61.2%Other
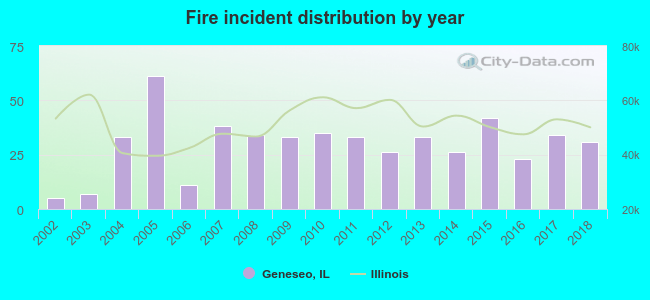 According to the data from the years 2002 - 2018 the average number of fire incidents per year is 30. The highest number of reported fire incidents - 61 took place in 2005, and the least - 5 in 2002. The data has an increasing trend.
The average number of yearly fire incidents per 10k residents in Geneseo, IL compared to nearest cities:
(Note: Based on data for the last 3 years, including only cities with population 5,000 and above)
| Geneseo: | 44.9 |
| Colona: | 119.0 |
| Silvis: | 30.1 |
| East Moline: | 45.0 |
| Moline: | 25.3 |
| Kewanee: | 50.0 |
| Milan: | 66.6 |
| Rock Island: | 24.4 |
| Rock Falls: | 78.7 |
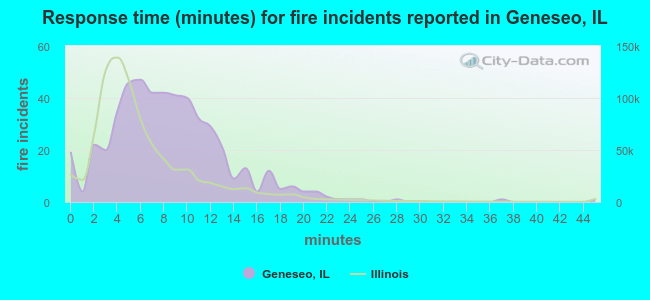 The median response time based on all reported fire incidents is 8 minutes. This is higher compared to the state median value.
The median response time in Geneseo, IL compared to nearest cities:
(Note: Based on data for all years, including only cities with at least 500 fire incidents)
| Geneseo: | 8 minutes |
| Colona: | 6 minutes |
| East Moline: | 5 minutes |
| Moline: | 5 minutes |
| Kewanee: | 3 minutes |
| Milan: | 8 minutes |
| Rock Island: | 4 minutes |
| Morrison: | 7 minutes |
| Rock Falls: | 7 minutes |
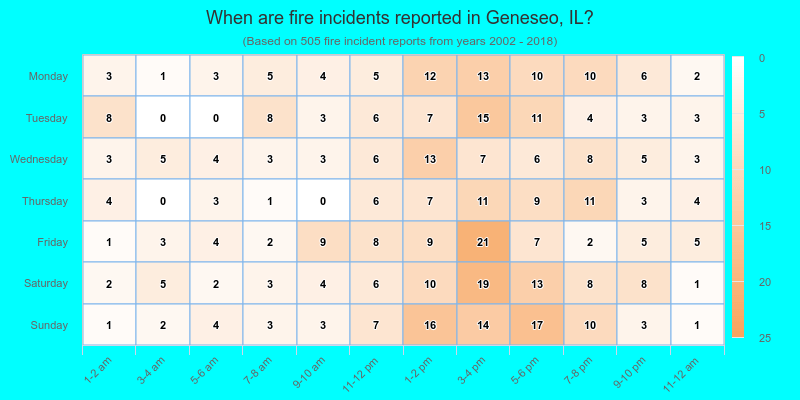
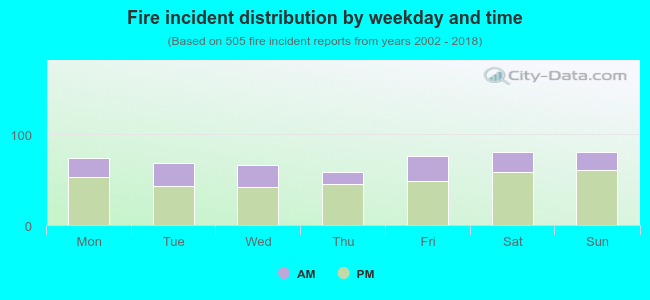 30.3% incidents where reported in the morning and 69.7% in the evening. The most fires (16.0%) took place on Saturday, and the least (11.7%) on Thursday.
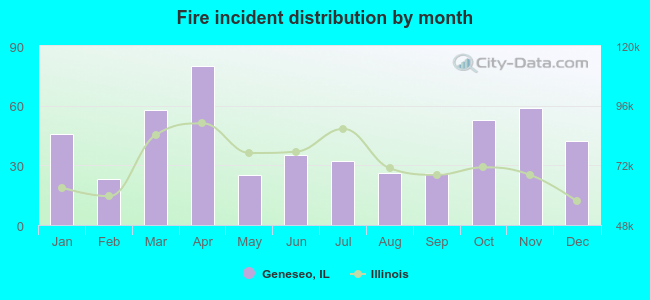 Based on the 505 fire incidents from years 2002 - 2018 most fires (15.8%) took place during April, and the least (4.6%) in February.
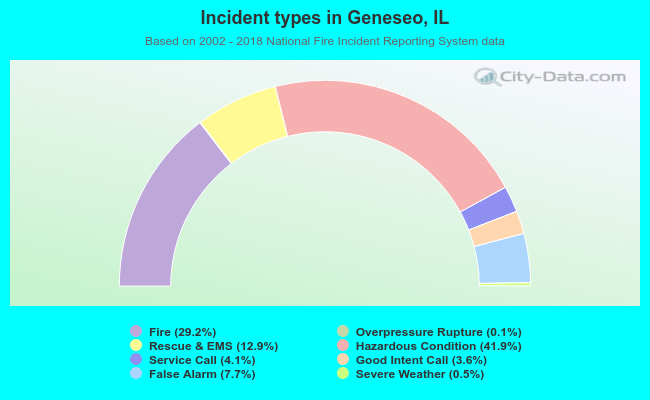 Out of all 1,729 cases reported during the years 2002 - 2018, the most belonged to the categories: Hazardous Condition (41.9%), Fire (29.2%), and Rescue & EMS (12.9%).
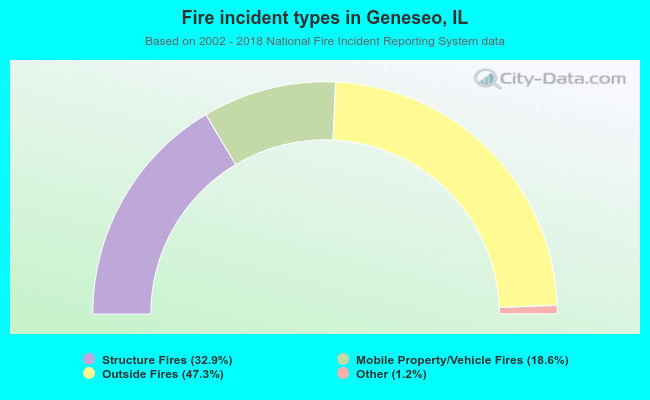 When looking into fire subcategories, the most incidents belonged to: Outside Fires (47.3%), and Structure Fires (32.9%).