| Fire incidents reported |
|---|
| Sreet name | Count |
|---|
| 189 EAST 400 NORTH | 4 | | 2500 NORTH 1600 WEST | 4 | | 379 NORTH 400 WEST | 4 | | 400 EAST 800 SOUTH | 4 | | 455 NORTH MAIN | 4 | | 491 SOUTH 800 EAST | 4 | | 498 WEST CENTER | 4 | | HWY 141 MM 4 | 4 | | LAKE RD | 4 | | WARM SPRINGS RD | 4 | | WEST MT | 4 | | ST | 2 | | 10 NORTH STATE | 2 | | 10 SOUTH MAIN | 2 | | 10 WEST CENTER | 2 | | 1000 EAST 800 NORTH | 2 | | 1000 EAST 200 SOUTH | 2 | | 1000 EAST HWY 6 | 2 | | 1000 SOUTH ANNA EKINS LANE | 2 | | 1072 E CUMORAH DR | 2 | | 1072 EAST CUMORAH DR | 2 | | 1175 S 400 W | 2 | | 1200 NORTH 900 EAST | 2 | | 1220 N HILLSIDE D | 2 | | 1220 NORTH HILLSIDE DRIVE | 2 |
| | | Fire incidents reported |
|---|
| Sreet name | Count |
|---|
| 1220 NORTH LAKEVIEW DRIVE | 2 | | 1273 SOUTH 400 WEST | 2 | | 1280 SOUTH STATE | 2 | | 1300 EAST 150 SOUTH | 2 | | 1300 N 1500 E | 2 | | 1430 SOUTH STATE STREET | 2 | | 1460 S SR198 | 2 | | 1500 EAST 1000 NORTH | 2 | | 1520 NORTH HILLSIDE DR | 2 | | 1690 SOUTH STATE | 2 | | 1700 SOUTH HWY 6 | 2 | | 1900 NORTH LAKE RD | 2 | | 1920 NORTH LAKE RD | 2 | | 1920 NORTH LAKE ROAD | 2 | | 1928 NORTH LAKE RD | 2 | | 20 EAST 800 EAST | 2 | | 200 S | 2 | | 200 SOUTH 100 EAST | 2 | | 200 SOUTH STATE RD | 2 | | 2000 NORTH LAKE RD | 2 | | 2005 SOUTH WARM SPRINGS RD | 2 | | 209 EAST 400 NORTH | 2 | | 215 SOUTH 800 EAST | 2 | | 217 NORTH SUNSET LANE | 2 | | |
|
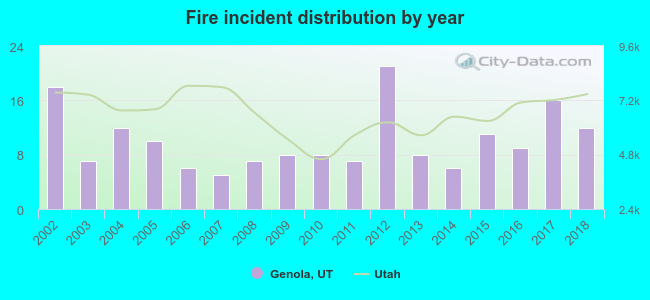 According to the data from the years 2002 - 2018 the average number of fire incidents per year is 10. The highest number of reported fires - 21 took place in 2012, and the least - 5 in 2007. The data has a dropping trend.
 22.2% incidents where reported in the morning and 77.8% in the evening. The most fires (18.7%) took place on Saturday, and the least (10.5%) on Sunday.
 According to the 171 fire incidents from years 2002 - 2018 most fires (17.5%) took place during June, and the least (1.2%) in October.
 Out of all 282 cases reported during the years 2002 - 2018, the most belonged to the categories: Fire (60.6%), Rescue & EMS (13.8%), and Good Intent Call (9.2%).
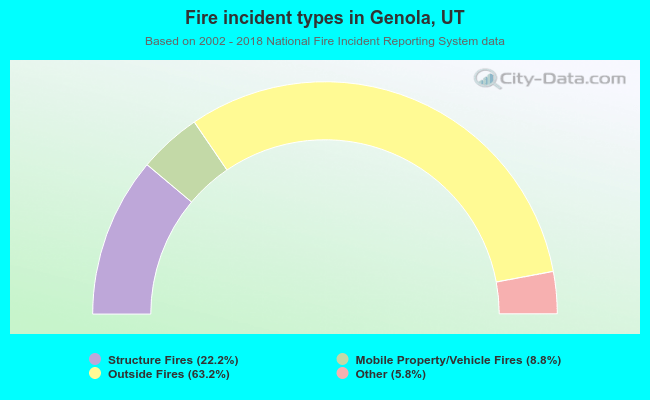 When looking into fire subcategories, the most incidents belonged to: Outside Fires (63.2%), and Structure Fires (22.2%).