Gentryville: Fire Incidents, Indiana (IN)
Where are fire incidents reported in Gentryville, IN
Something went wrong! Please refresh the page.
|
| |||||||||||||||||||||||||||||||||||||||||||||||||||||||||||||||||
| Other | 58 | |||||||||||||||||||||||||||||||||||||||||||||||||||||||||||||||||
2002 - 2017 National Fire Incident Reporting System (NFIRS) incidents
- Incident types reported to NFIRS in Gentryville, IN
- 12067.8%Fire
- 2111.9%Good Intent Call
- 179.6%Rescue & EMS
- 158.5%Hazardous Condition
- 21.1%Service Call
- 21.1%Severe Weather
- Fire incident types reported to NFIRS in Gentryville, IN
- 4537.5%Structure Fires
- 4537.5%Outside Fires
- 1714.2%Mobile Property/Vehicle Fires
- 1310.8%Other
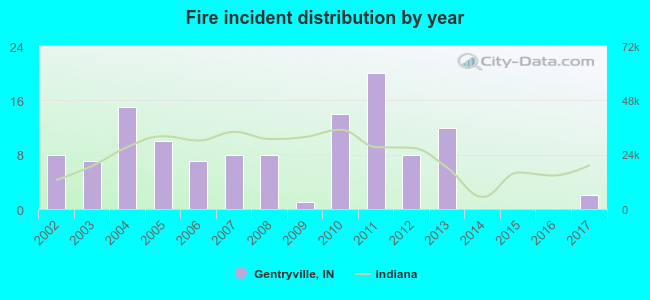 According to the data from the years 2002 - 2017 the average number of fire incidents per year is 8. The highest number of fire incidents - 20 took place in 2011, and the least - 0 in 2014. The data has a decreasing trend.
 39.2% incidents where reported in the morning and 60.8% in the evening. The most fires (21.7%) took place on Sunday, and the least (7.5%) on Monday.
 Based on the 120 fires from years 2002 - 2017 most fires (19.2%) took place during March, and the least (4.2%) in May.
 Out of all 177 cases reported during the years 2002 - 2017, the most belonged to the categories: Fire (67.8%), Service Call (11.9%), and Overpressure Rupture (9.6%).
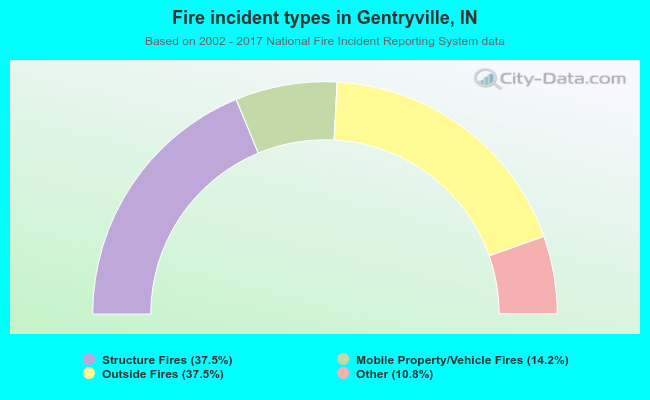 When looking into fire subcategories, the most reports belonged to: Structure Fires (37.5%), and Outside Fires (37.5%).