| Fire incidents reported |
|---|
| Sreet name | Count |
|---|
| STATE ROUTE 186 HWY | 26 | | STATE ROUTE 187 HWY | 16 | | ST RT 187 RT | 12 | | HUMBOLDT HWY | 10 | | ST RT 186 | 10 | | ST RT 186 NORTH RT | 10 | | GIBSON CEMETERY RD RD | 8 | | HUMBOLDT HWY HWY | 8 | | HWY 79 | 8 | | JIM BOB SCRUGGS RD | 8 | | MILAN HWY | 8 | | STAVELY RD | 8 | | DONALD BEARD LN | 6 | | MILAN HWY HWY | 6 | | PARKER ST | 6 | | PLEASANT HILL RD | 6 | | SANDERS STORE MILAN RD RD | 6 | | ST RT 186 N RT | 6 | | ST RT 186 S HWY | 6 | | ST RT 186N HWY | 6 | | ST RT 420 HWY | 6 | | STATE ROUTE 187 | 6 | | 79 HWY | 4 | | DAWSON BOTTOM RD RD | 4 | | ELDAD RD | 4 |
| | | Fire incidents reported |
|---|
| Sreet name | Count |
|---|
| ESQ ESTES RD | 4 | | ESQUIRE ESTES RD | 4 | | HWY79 | 4 | | JAMES RD | 4 | | JIM BOB SCRUGGS RD RD | 4 | | JIM JACKSON RD | 4 | | JIM JACKSON RD RD | 4 | | MANUSRD | 4 | | MARY ANN ST ST | 4 | | PLEASANT HILL RD RD | 4 | | ST RT 186 NORTH | 4 | | ST RT 186 RT | 4 | | ST RT 186 SOUTH RT | 4 | | STATE ROUTE 186 | 4 | | WILSON STEEL RD RD | 4 | | 0 STATE ROUTE 187 | 2 | | 100 PLEASANT HILL RD | 2 | | 142 SOUTH MAIN STREET | 2 | | 2 DAWSON BOTTOM RD | 2 | | 210 GIBSON CEMETERY RD | 2 | | 3 CEDAR CV | 2 | | 412 STATE ROUTE 420 | 2 | | 63 MILANHWY | 2 | | ANNIE BROOK RD | 2 | | |
|
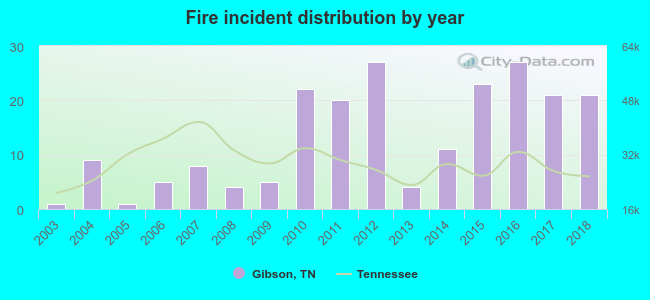 According to the data from the years 2003 - 2018 the average number of fire incidents per year is 13. The highest number of reported fires - 27 took place in 2012, and the least - 1 in 2003. The data has a growing trend.
 23.9% incidents where reported in the morning and 76.1% in the evening. The most fires (21.1%) took place on Saturday, and the least (10.0%) on Friday.
 Based on the 209 reports from years 2003 - 2018 most fires (14.8%) took place during January, and the least (3.3%) in May.
 Out of all 505 cases reported during the years 2003 - 2018, the most belonged to the categories: Fire (41.4%), Overpressure Rupture (38.6%), and Service Call (7.9%).
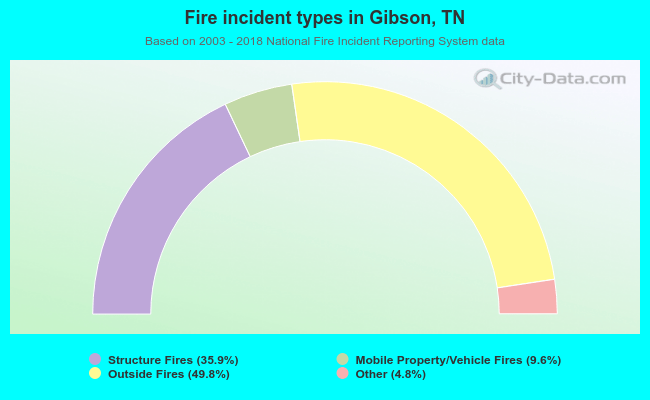 When looking into fire subcategories, the most reports belonged to: Outside Fires (49.8%), and Structure Fires (35.9%).