Gilcrest: Fire Incidents, Colorado (CO)
Where are fire incidents reported in Gilcrest, CO
Something went wrong! Please refresh the page.
|
| |||||||||||||||||||||||||||||||||||||||||||||||||||||||||||||||||||||||||||||||||||||||||
2007 - 2018 National Fire Incident Reporting System (NFIRS) incidents
- Incident types reported to NFIRS in Gilcrest, CO
- 33753.8%Rescue & EMS
- 10316.5%Good Intent Call
- 10216.3%Fire
- 315.0%Hazardous Condition
- 274.3%Service Call
- 233.7%False Alarm
- 20.3%Severe Weather
- 10.2%Special Incident
- Fire incident types reported to NFIRS in Gilcrest, CO
- 6664.7%Outside Fires
- 2019.6%Structure Fires
- 98.8%Other
- 76.9%Mobile Property/Vehicle Fires
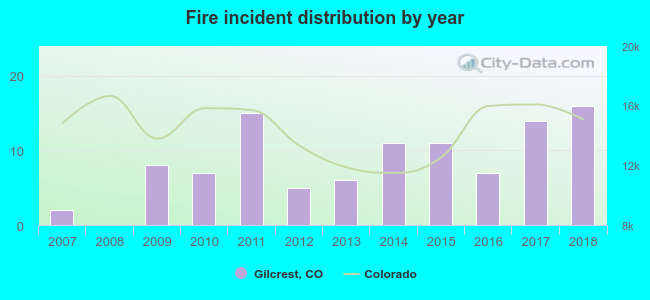 According to the data from the years 2007 - 2018 the average number of fires per year is 9. The highest number of fires - 16 took place in 2018, and the least - 0 in 2008. The data has a growing trend.
 26.5% incidents where reported in the morning and 73.5% in the evening. The most fires (23.5%) took place on Tuesday, and the least (10.8%) on Monday.
 Based on the 102 incident reports from years 2007 - 2018 most fires (17.6%) took place during April, and the least (2.0%) in January.
 Out of all 626 cases reported during the years 2007 - 2018, the most belonged to the categories: Overpressure Rupture (53.8%), Service Call (16.5%), and Fire (16.3%).
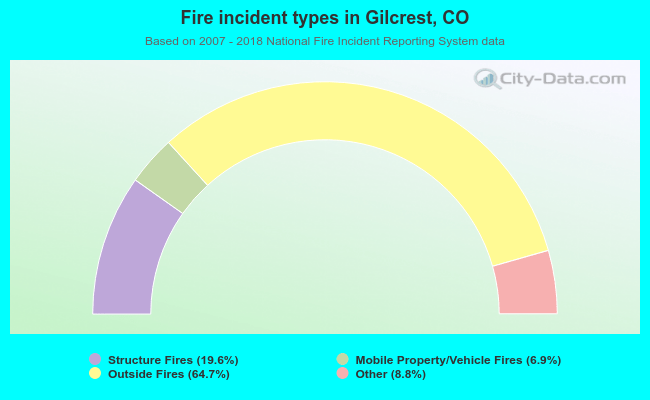 When looking into fire subcategories, the most incidents belonged to: Outside Fires (64.7%), and Structure Fires (19.6%).