Girard: Fire Incidents, Kansas (KS)
Where are fire incidents reported in Girard, KS
Something went wrong! Please refresh the page.
|
| |||||||||||||||||||||||||||||||||||||||||||||||||||||||||||||||||||||||||||||||||||||||||||||||||||||||||||||
2002 - 2018 National Fire Incident Reporting System (NFIRS) incidents
- Incident types reported to NFIRS in Girard, KS
- 95438.2%Rescue & EMS
- 55822.4%Hazardous Condition
- 45018.0%Fire
- 32813.1%Good Intent Call
- 1214.8%Service Call
- 672.7%False Alarm
- 140.6%Severe Weather
- 30.1%Special Incident
- Fire incident types reported to NFIRS in Girard, KS
- 18541.1%Structure Fires
- 16236.0%Outside Fires
- 7717.1%Mobile Property/Vehicle Fires
- 265.8%Other
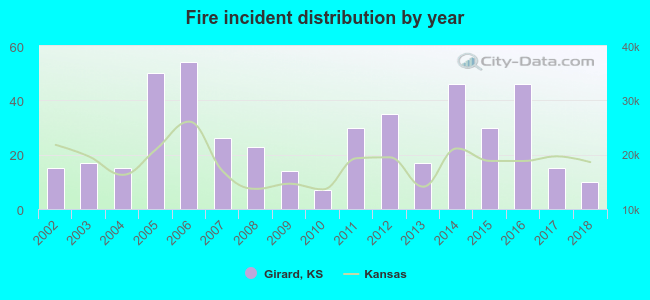 According to the data from the years 2002 - 2018 the average number of fire incidents per year is 26. The highest number of fires - 54 took place in 2006, and the least - 7 in 2010. The data has a declining trend.
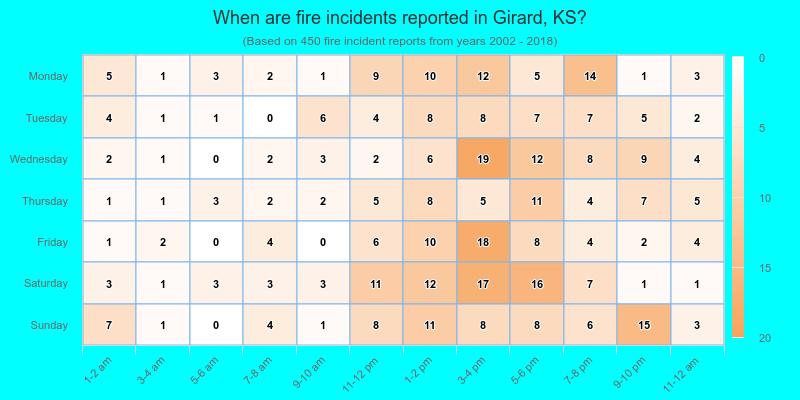
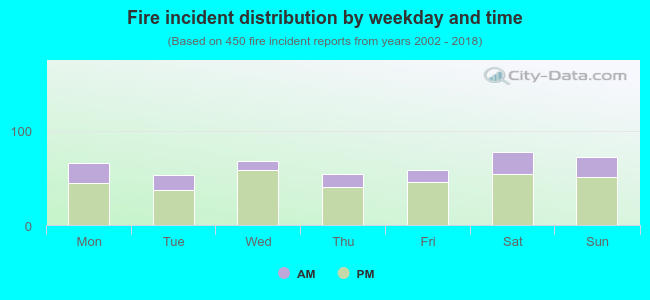 26.4% incidents where reported in the morning and 73.6% in the evening. The most fires (17.3%) took place on Saturday, and the least (11.8%) on Tuesday.
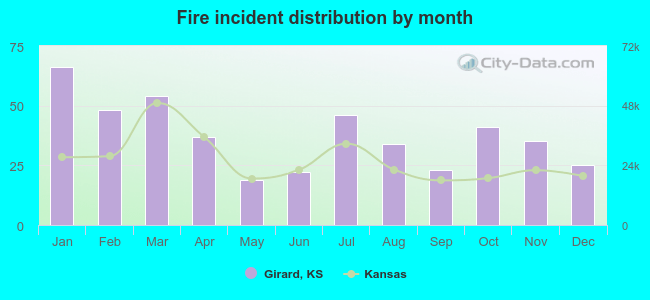 Based on the 450 fire incident reports from years 2002 - 2018 most fires (14.7%) took place during January, and the least (4.2%) in May.
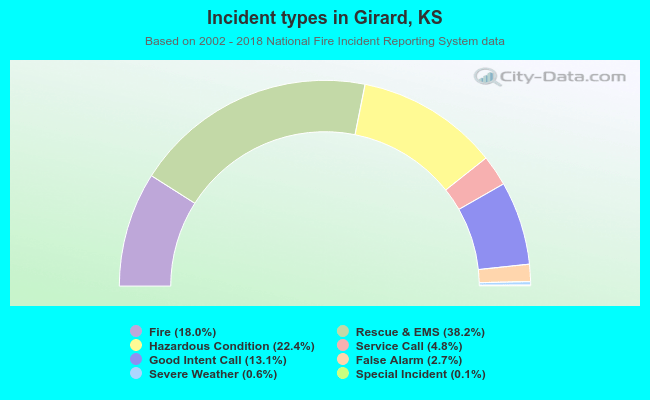 Out of all 2,495 cases reported during the years 2002 - 2018, the most belonged to the categories: Overpressure Rupture (38.2%), Rescue & EMS (22.4%), and Fire (18.0%).
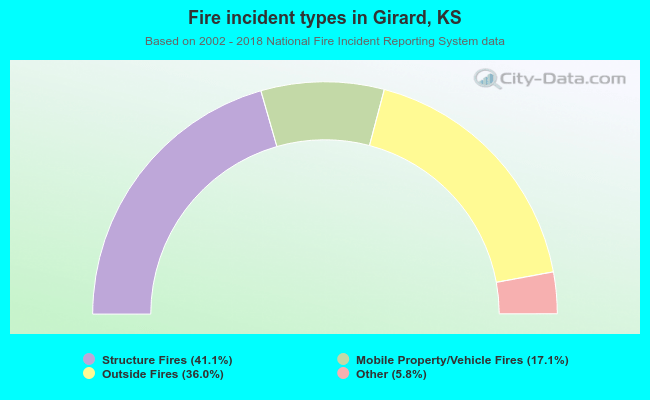 When looking into fire subcategories, the most reports belonged to: Structure Fires (41.1%), and Outside Fires (36.0%).