| Fire incidents reported |
|---|
| Sreet name | Count |
|---|
| LEE HWY | 20 | | LOVES MILL RD | 14 | | INTERSTATE 81 | 12 | | 35218 LOVES MILL RD | 10 | | INTERSTATE 81 HWY | 10 | | 36511 FARRIS DR. | 8 | | MONROE RD | 8 | | OLD MILL RD. | 8 | | 10735 FOREST HILLS DR. | 6 | | BLUE HILLS DR | 6 | | BUCKS BRIDGE RD | 6 | | HEMLOCK ST | 6 | | LEE HIGHWAY | 6 | | MAPLE ST | 6 | | MAPLE ST. | 6 | | OLD MILL RD | 6 | | RAMBLEWOOD DR | 6 | | 12287 PRICES BRIDGE RD | 4 | | 12433 MAPLE ST. | 4 | | 209 SHENANDOAH DR. | 4 | | 32272 DABNEY RD. | 4 | | 37471 LEE HWY | 4 | | 404 WEST GLADE ST | 4 | | 9097 OLD MILL RD. | 4 | | ALLISON LANE | 4 |
| | | Fire incidents reported |
|---|
| Sreet name | Count |
|---|
| BEECH GROVE RD | 4 | | BLUE HILLS DR. | 4 | | CRESCENT RD | 4 | | FARRIS DR | 4 | | GLOVE DR | 4 | | HANGER LN | 4 | | HAWKE RD | 4 | | HILLMAN HWY. | 4 | | LEE HWY | 4 | | MAPLE ST | 4 | | MONROE ROAD | 4 | | OLD MILL ROAD | 4 | | FOREST HILL DR | 2 | | 10159 CREASCENT RD | 2 | | 1028 CRESCENT RD | 2 | | 104 FAIRMONT ST. | 2 | | 10436 ECHO LANE | 2 | | 10494 FOREST HILL DR. | 2 | | 10515 FOREST HILLS DR. | 2 | | 107 CURTIS LANE | 2 | | 11585 MONT CALM DR. | 2 | | 12183 FREINDSHIP RD. | 2 | | 12319 MAPLE ST. | 2 | | 12322 MAPLE ST | 2 | | |
|
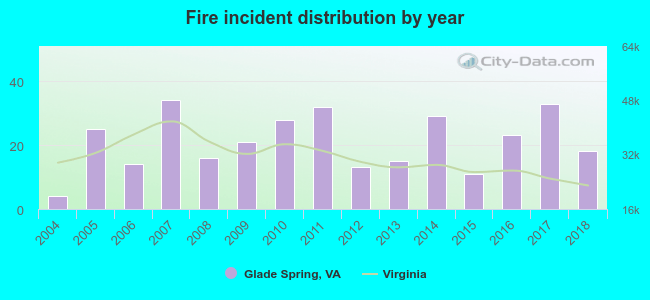 Based on the data from the years 2004 - 2018 the average number of fire incidents per year is 21. The highest number of reported fire incidents - 34 took place in 2007, and the least - 4 in 2004. The data has an increasing trend.
 30.4% incidents where reported in the morning and 69.6% in the evening. The most fires (18.4%) took place on Thursday, and the least (9.5%) on Friday.
 According to the 316 reports from years 2004 - 2018 most fires (12.7%) took place during December, and the least (4.7%) in September.
 Out of all 933 cases reported during the years 2004 - 2018, the most belonged to the categories: Fire (33.9%), Rescue & EMS (27.7%), and Overpressure Rupture (20.3%).
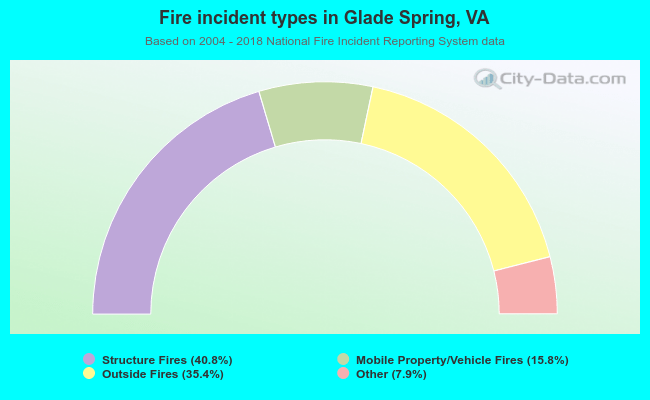 When looking into fire subcategories, the most reports belonged to: Structure Fires (40.8%), and Outside Fires (35.4%).