| Fire incidents reported |
|---|
| Sreet name | Count |
|---|
| 3940 98R AVE SW | 6 | | 10325 34TH ST SW | 4 | | 10454 47TH ST SW | 4 | | 21ST SW AND 101ST SW | 4 | | 3645 98TH AVE SW | 4 | | 3899 99TH AVE SW | 4 | | 4025 97M AVE SW | 4 | | 9725 40TH ST SW | 4 | | 9980 41 ST SW | 4 | | I-94 | 4 | | I94 MILE MARKER 68 | 4 | | 1 AV N | 2 | | 100 36TH ST SW | 2 | | 100 47 ST SW | 2 | | 100 AVE SW HWY 10 | 2 | | 100 SPRUCE ST | 2 | | 10040 HIGHWAY 10 | 2 | | 100M AVE | 2 | | 100M AVE SW 40M ST SW | 2 | | 100M AVE SW 40TH ST SW | 2 | | 101 23RD ST SW | 2 | | 101 35TH ST SW | 2 | | 10105 38 ST SW | 2 | | 10125 41ST SW | 2 | | 102 34ST ST | 2 |
| | | Fire incidents reported |
|---|
| Sreet name | Count |
|---|
| 102 HWY 10 | 2 | | 10225 HWY 10 | 2 | | 10238 ST SW | 2 | | 10250 25TH ST SW | 2 | | 10250 41ST ST SW | 2 | | 10251 40TH R SW | 2 | | 10280 ST SW | 2 | | 10293 33P ST SW | 2 | | 103 30TH ST SW | 2 | | 103 38 ST SW | 2 | | 103 43ST SW | 2 | | 103 R AV | 2 | | 10340 47TH ST SW | 2 | | 10350 36ST SW | 2 | | 10360 40TH ST SW | 2 | | 10366 43RD D ST | 2 | | 10388 35TH ST SW | 2 | | 104 38 ST SW | 2 | | 10425 34TH ST SW | 2 | | 10425 36TH ST SW | 2 | | 104340R ST SW | 2 | | 10435 39TH ST SW | 2 | | 10435 40 ST SW | 2 | | 10435 40TH ST SW | 2 | | 10450 38TH AVE SW | 2 |
|
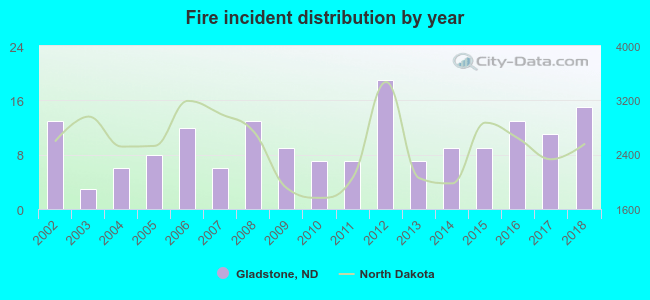 Based on the data from the years 2002 - 2018 the average number of fires per year is 10. The highest number of reported fire incidents - 19 took place in 2012, and the least - 3 in 2003. The data has a growing trend.
 26.9% incidents where reported in the morning and 73.1% in the evening. The most fires (25.1%) took place on Wednesday, and the least (5.4%) on Saturday.
 Based on the 167 fires from years 2002 - 2018 most fires (18.6%) took place during August, and the least (1.8%) in January.
 Out of all 176 cases reported during the years 2002 - 2018, the most belonged to the categories: Fire (94.9%), Good Intent Call (2.3%), and Overpressure Rupture (1.1%).
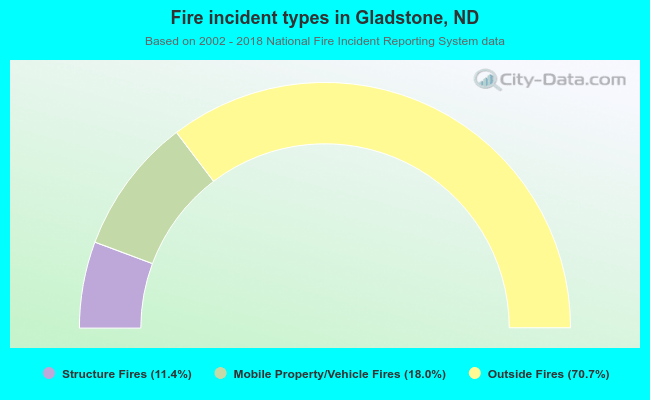 When looking into fire subcategories, the most incidents belonged to: Outside Fires (70.7%), and Mobile Property/Vehicle Fires (18.0%).