Glenwood: Fire Incidents, Indiana (IN)
Where are fire incidents reported in Glenwood, IN
Something went wrong! Please refresh the page.
|
| |||||||||||||||||||||||||||||||||||||||||||||||||||||||||||||||||||||||||||||||||||||||||||||||||||||||||
2002 - 2018 National Fire Incident Reporting System (NFIRS) incidents
- Incident types reported to NFIRS in Glenwood, IN
- 10744.6%Fire
- 8535.4%Rescue & EMS
- 2610.8%Hazardous Condition
- 104.2%Service Call
- 83.3%Good Intent Call
- 20.8%Severe Weather
- 10.4%Overpressure Rupture
- 10.4%Special Incident
- Fire incident types reported to NFIRS in Glenwood, IN
- 5551.4%Structure Fires
- 3330.8%Outside Fires
- 1615.0%Mobile Property/Vehicle Fires
- 32.8%Other
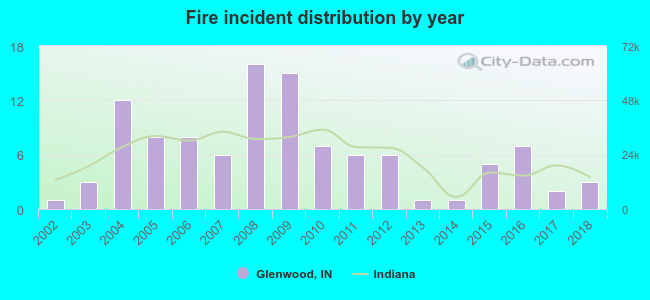 Based on the data from the years 2002 - 2018 the average number of fire incidents per year is 6. The highest number of fires - 16 took place in 2008, and the least - 1 in 2002. The data has an increasing trend.
 29.9% incidents where reported in the morning and 70.1% in the evening. The most fires (18.7%) took place on Saturday, and the least (8.4%) on Tuesday.
 According to the 107 fire incidents from years 2002 - 2018 most fires (18.7%) took place during March, and the least (0.0%) in July.
 Out of all 240 cases reported during the years 2002 - 2018, the most belonged to the categories: Fire (44.6%), Rescue & EMS (35.4%), and Hazardous Condition (10.8%).
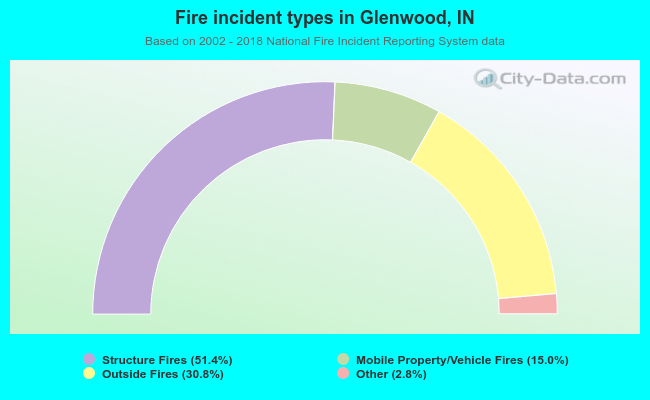 When looking into fire subcategories, the most reports belonged to: Structure Fires (51.4%), and Outside Fires (30.8%).