Glidden: Fire Incidents, Iowa (IA)
Where are fire incidents reported in Glidden, IA
Something went wrong! Please refresh the page.
|
| |||||||||||||||||||||||||||||||||||||||||||||||||||||||||||||||||||||||||||||||||||||||||||||||||||||||||||||
| Other | 62 | |||||||||||||||||||||||||||||||||||||||||||||||||||||||||||||||||||||||||||||||||||||||||||||||||||||||||||||
2002 - 2017 National Fire Incident Reporting System (NFIRS) incidents
- Incident types reported to NFIRS in Glidden, IA
- 19066.2%Fire
- 3813.2%Rescue & EMS
- 3211.1%Hazardous Condition
- 124.2%Good Intent Call
- 113.8%False Alarm
- 20.7%Special Incident
- 10.3%Service Call
- 10.3%Severe Weather
- Fire incident types reported to NFIRS in Glidden, IA
- 8142.6%Outside Fires
- 6333.2%Structure Fires
- 4021.1%Mobile Property/Vehicle Fires
- 63.2%Other
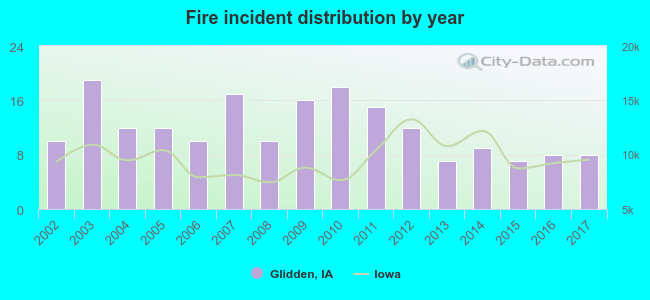 According to the data from the years 2002 - 2017 the average number of fires per year is 12. The highest number of reported fires - 19 took place in 2003, and the least - 7 in 2013. The data has a decreasing trend.
 32.1% incidents where reported in the morning and 67.9% in the evening. The most fires (17.9%) took place on Sunday, and the least (10.5%) on Friday.
 According to the 190 fire incidents from years 2002 - 2017 most fires (15.3%) took place during October, and the least (4.2%) in August.
 Out of all 287 cases reported during the years 2002 - 2017, the most belonged to the categories: Fire (66.2%), Overpressure Rupture (13.2%), and Rescue & EMS (11.1%).
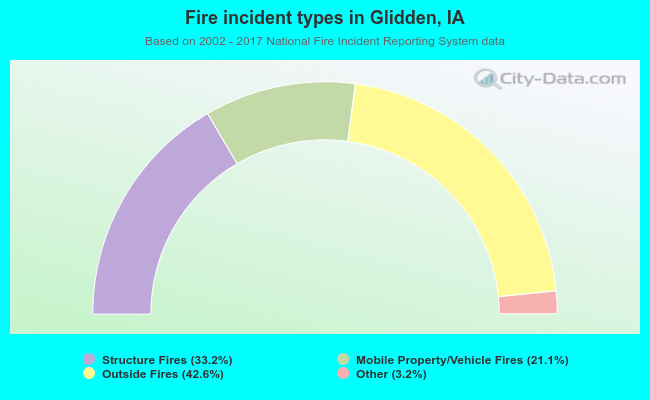 When looking into fire subcategories, the most incidents belonged to: Outside Fires (42.6%), and Structure Fires (33.2%).