Goodyear: Fire Incidents, Arizona (AZ)
Where are fire incidents reported in Goodyear, AZ
Something went wrong! Please refresh the page.
| Fire incidents reported | |
|---|---|
| Sreet name | Count |
| LITCHFIELD RD | 290 |
| COTTON LN | 200 |
| I10 | 190 |
| ESTRELLA PW | 142 |
| CITRUS RD | 110 |
| MCDOWELL RD | 90 |
| BROADWAY RD | 60 |
| INDIAN SCHOOL RD | 60 |
| BULLARD AV | 56 |
| A303 | 46 |
| DYSART RD | 46 |
| ESTRELLA | 46 |
| PALO VERDE DR | 40 |
| YUMA RD | 38 |
| SARIVAL AV | 30 |
| COMMERCE DR | 26 |
| LOS ROBLES DR | 24 |
| ELLIOT RD | 22 |
| ELWOOD ST | 22 |
| LOWER BUCKEYE RD | 22 |
| VAN BUREN ST | 22 |
| 159TH AV | 20 |
| 175TH AV | 20 |
| WATKINS ST | 20 |
| 144TH AV | 18 |
| CAMELBACK RD | 18 |
| LA COMETA | 18 |
| 167TH DR | 16 |
| CALLE ADOBE LN | 16 |
| CHANDLER HEIGHTS RD | 16 |
2004 - 2018 National Fire Incident Reporting System (NFIRS) incidents
- Incident types reported to NFIRS in Goodyear, AZ
- 19,93271.7%Rescue & EMS
- 2,0267.3%Good Intent Call
- 1,7236.2%Fire
- 1,6816.0%Service Call
- 1,4745.3%False Alarm
- 9253.3%Hazardous Condition
- 430.2%Special Incident
- Fire incident types reported to NFIRS in Goodyear, AZ
- 60635.2%Structure Fires
- 54931.9%Outside Fires
- 37621.8%Mobile Property/Vehicle Fires
- 19211.1%Other
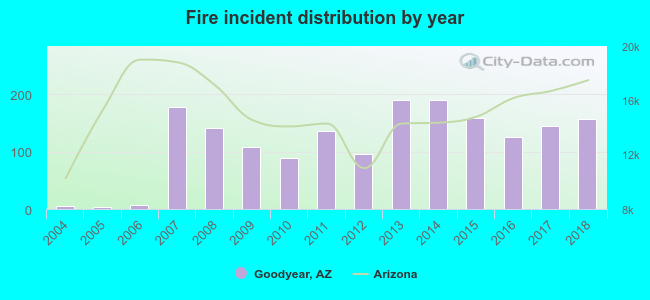 Based on the data from the years 2004 - 2018 the average number of fire incidents per year is 115. The highest number of reported fires - 189 took place in 2013, and the least - 4 in 2005. The data has a growing trend.
The average number of yearly fire incidents per 10k residents in Goodyear, AZ compared to nearest cities:
(Note: Based on data for the last 3 years, including only cities with population 5,000 and above)
| Goodyear: | 18.8 |
| Avondale: | 34.3 |
| Litchfield Park: | 17.9 |
| Tolleson: | 96.7 |
| Buckeye: | 28.3 |
| Youngtown: | 53.5 |
| El Mirage: | 32.0 |
| Sun City: | 22.6 |
| Glendale: | 0.8 |
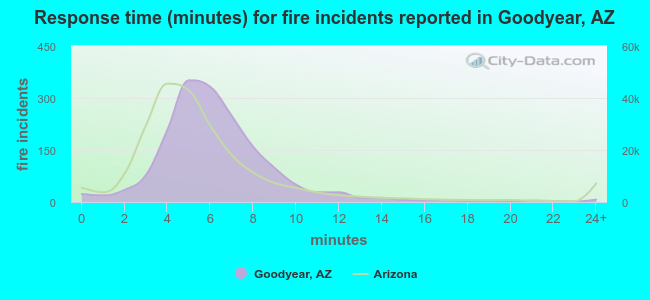 The median response time based on all reported fire incidents is 6 minutes. This is about the same as the state median value.
The median response time in Goodyear, AZ compared to nearest cities:
(Note: Based on data for all years, including only cities with at least 500 fire incidents)
| Goodyear: | 6 minutes |
| Avondale: | 5 minutes |
| Buckeye: | 6 minutes |
| El Mirage: | 5 minutes |
| Sun City: | 4 minutes |
| Glendale: | 4 minutes |
| Surprise: | 5 minutes |
| Peoria: | 5 minutes |
| Phoenix: | 4 minutes |
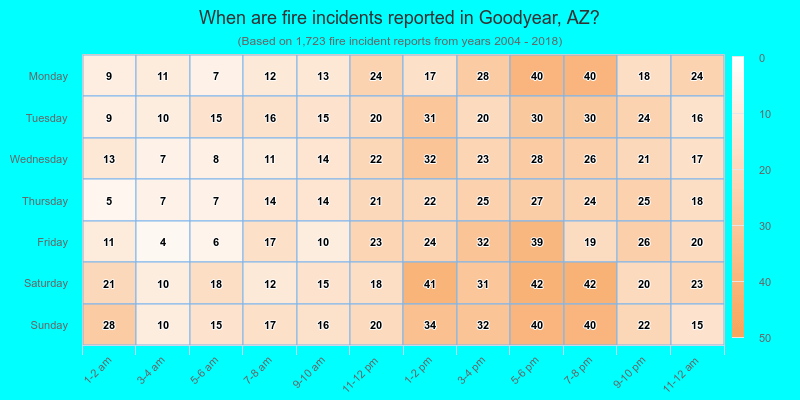
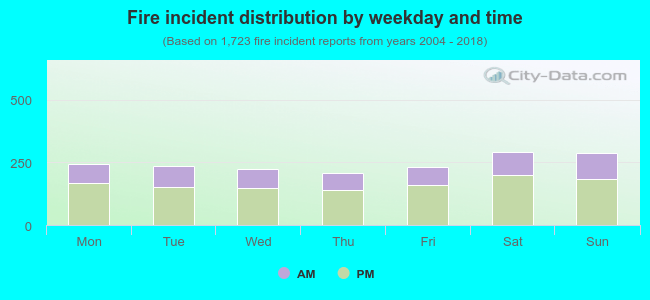 33.4% incidents where reported in the morning and 66.6% in the evening. The most fires (17.0%) took place on Saturday, and the least (12.1%) on Thursday.
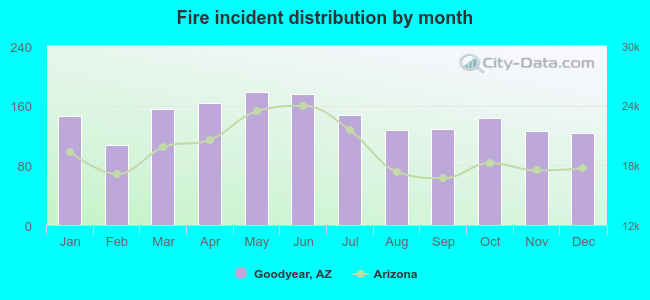 Based on the 1,723 incident reports from years 2004 - 2018 most fires (10.3%) took place during May, and the least (6.2%) in February.
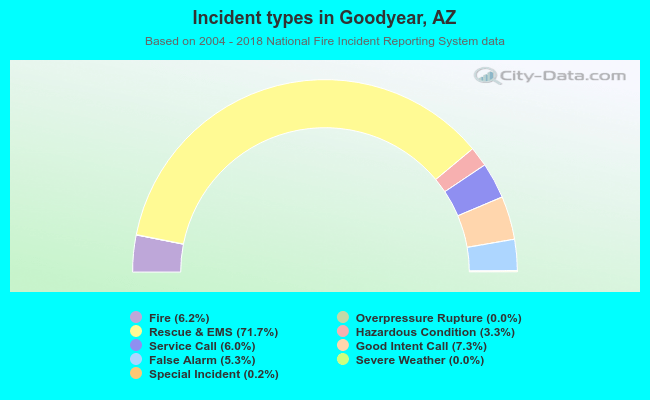 Out of all 27,814 cases reported during the years 2004 - 2018, the most belonged to the categories: Rescue & EMS (71.7%), Good Intent Call (7.3%), and Fire (6.2%).
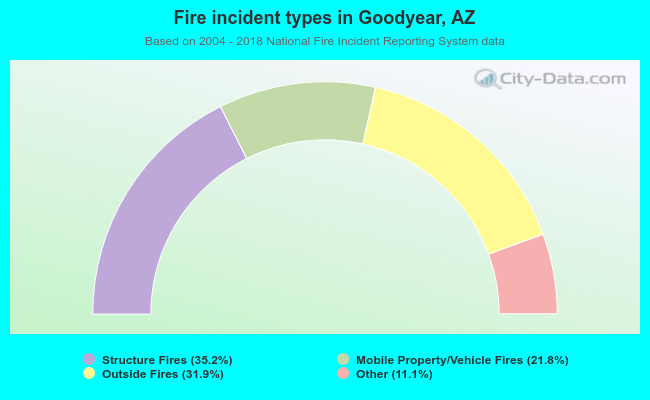 When looking into fire subcategories, the most reports belonged to: Structure Fires (35.2%), and Outside Fires (31.9%).