| Fire incidents reported |
|---|
| Sreet name | Count |
|---|
| 10A HWY | 36 | | HWY10A | 20 | | LOCK & DAM ROAD | 18 | | HWY100 | 14 | | HWY 100 | 12 | | ORCHARD ROAD | 12 | | MOONSHINE HIGHWAY | 10 | | OK HWY 10 | 10 | | TENKILLER DAM HWY 100 | 10 | | 100 HWY | 8 | | 4445 RD | 8 | | GOLDEN POND ROAD | 8 | | GORE LANDING ROAD | 8 | | 10 HWY | 6 | | 139TH | 6 | | 4446 RD | 6 | | 4450 10A RDS | 6 | | 4450 RD | 6 | | COUNTY LINE ROAD | 6 | | HAVEN HEIGHTS | 6 | | INDIAN RD | 6 | | MOONSHINE & RANCH RD | 6 | | MOONSHINE HWY | 6 | | ORCHARD RD | 6 | | TENKILLER HARBOR | 6 |
| | | Fire incidents reported |
|---|
| Sreet name | Count |
|---|
| 10-A & HWY 82 | 4 | | 4430 RD | 4 | | 4435 RD | 4 | | 4440 RD | 4 | | 966 RD | 4 | | 98687 SOUTH 4439 ROAD | 4 | | CEDAR CREEK ROAD | 4 | | CEDAR CREEK SCHOOL ROAD | 4 | | DOGWOOD MOBILE HOME PARK | 4 | | GOLDEN POND RD OFF OF MOONSHIN | 4 | | GORE COUNTY LINE ROAD | 4 | | GORE LOCK & DAM ROAD | 4 | | GORE SIDE WEBBERS FALLS DAM | 4 | | HAVEN HILLS | 4 | | HIGHWAY 10A | 4 | | HWY 10 | 4 | | HWY 10 & 10-A | 4 | | HWY 100 JOLLY ROGER | 4 | | HWY 10A | 4 | | HWY 64 | 4 | | HWY 64 & SAND PLANT RD | 4 | | HWY10 | 4 | | HWY10A & STRAYHORN LANDING | 4 | | INDIAN RD | 4 | | |
|
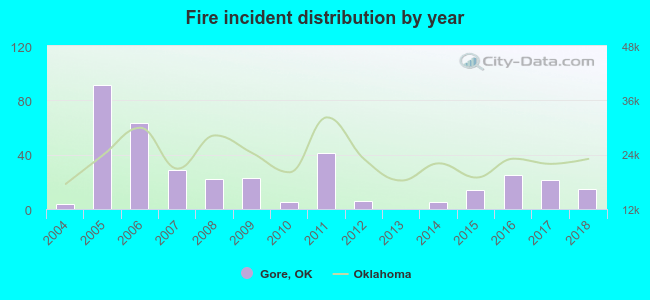 According to the data from the years 2004 - 2018 the average number of fires per year is 24. The highest number of fire incidents - 91 took place in 2005, and the least - 0 in 2013. The data has a growing trend.
 21.1% incidents where reported in the morning and 78.9% in the evening. The most fires (18.6%) took place on Saturday, and the least (9.9%) on Tuesday.
 According to the 365 fire incidents from years 2004 - 2018 most fires (17.3%) took place during March, and the least (2.5%) in May.
 Out of all 495 cases reported during the years 2004 - 2018, the most belonged to the categories: Fire (73.7%), Overpressure Rupture (14.3%), and Service Call (7.5%).
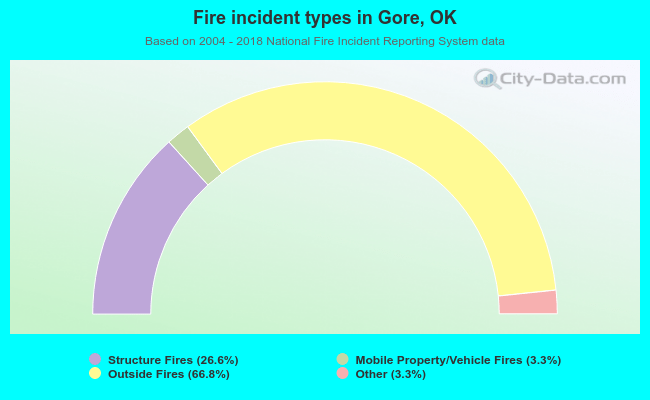 When looking into fire subcategories, the most reports belonged to: Outside Fires (66.8%), and Structure Fires (26.6%).