| Fire incidents reported |
|---|
| Sreet name | Count |
|---|
| 179TH STREET | 14 | | 176TH STREET | 12 | | 390TH AVE | 10 | | I70 HWY | 8 | | INTERSTATE 70 | 8 | | 177TH STREET | 6 | | I-70 | 6 | | I70 | 6 | | STICKNEY RD | 6 | | 1 MILE WEST OF GORHAM | 4 | | 175TH DECKER RD | 4 | | 176TH 15TH STREET RD | 4 | | 176TH ST | 4 | | 176TH ST | 4 | | 177 ST | 4 | | 178TH ST | 4 | | 178TH STREET | 4 | | 179TH HWY 40 | 4 | | 180TH STREET | 4 | | 3536 176TH ST | 4 | | 8TH ST | 4 | | HWY 40 | 4 | | I 70 | 4 | | I-70 ROAD | 4 | | PLYMOUTH RD | 4 |
| | | Fire incidents reported |
|---|
| Sreet name | Count |
|---|
| RESERVOIR RD | 4 | | SHORELINE RD | 4 | | SHORELINE ROAD | 4 | | WEST ST | 4 | | 115 N WEST S | 2 | | 15ST RD RD | 2 | | 15THST ROAD RD | 2 | | 17541 SHORELINE RD | 2 | | 175TH AIRBASE RD | 2 | | 175TH HOMESTEAD RD | 2 | | 175TH HWY 40 | 2 | | 175TH LAND RD | 2 | | 175TH SHORELINE RD | 2 | | 175TH ST | 2 | | 175TH STREET | 2 | | 175TH STREET RD | 2 | | 176 ST | 2 | | 176TH | 2 | | 176TH & MACCALUSTER ROAD | 2 | | 176TH 7 RESERVIOR RD | 2 | | 176TH I 70 | 2 | | 176TH I70 | 2 | | 176TH LINCOLN RD | 2 | | 176TH ST. ST | 2 | | |
|
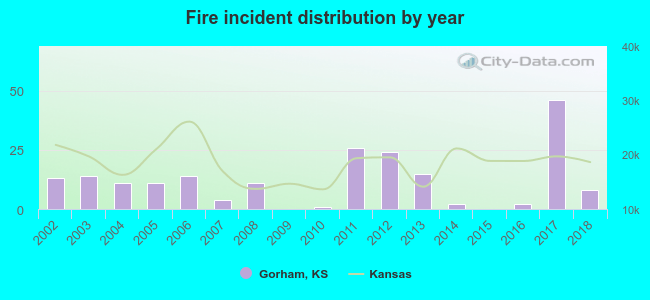 According to the data from the years 2002 - 2018 the average number of fires per year is 12. The highest number of reported fires - 46 took place in 2017, and the least - 0 in 2009. The data has a decreasing trend.
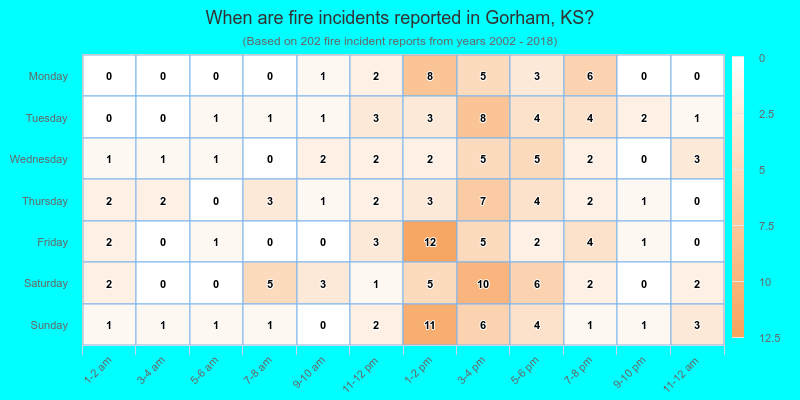
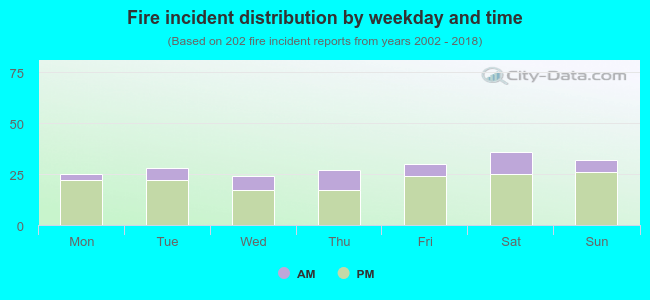 24.3% incidents where reported in the morning and 75.7% in the evening. The most fires (17.8%) took place on Saturday, and the least (11.9%) on Wednesday.
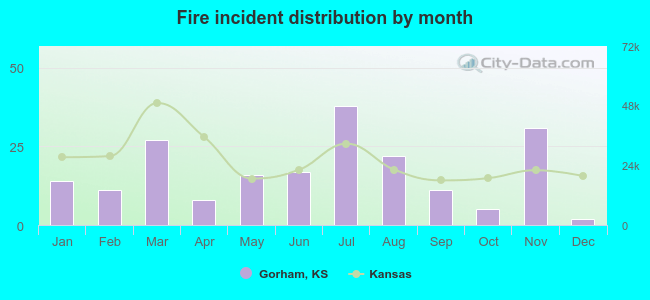 According to the 202 reports from years 2002 - 2018 most fires (18.8%) took place during July, and the least (1.0%) in December.
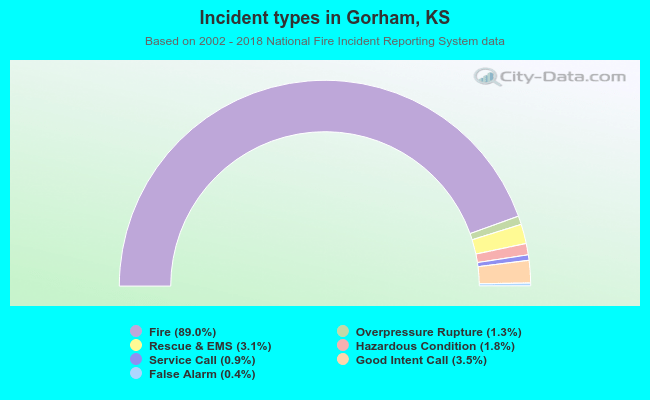 Out of all 227 cases reported during the years 2002 - 2018, the most belonged to the categories: Fire (89.0%), Good Intent Call (3.5%), and Rescue & EMS (3.1%).
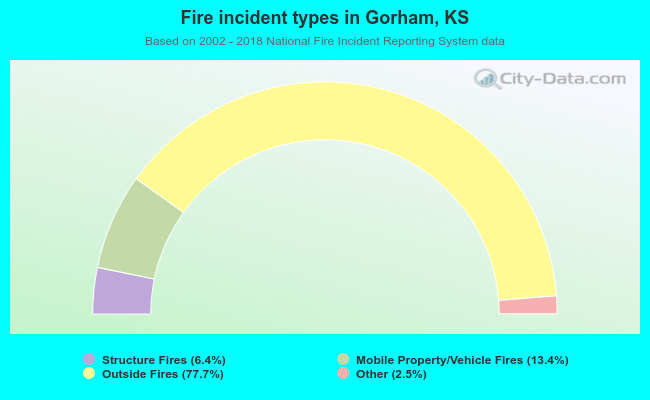 When looking into fire subcategories, the most incidents belonged to: Outside Fires (77.7%), and Mobile Property/Vehicle Fires (13.4%).