Goshen: Fire Incidents, California (CA)
Where are fire incidents reported in Goshen, CA
Something went wrong! Please refresh the page.
|
| |||||||||||||||||||||||||||||||||||||||||||||||||||||||||||||||||||||||||||||||||||||||||||||||||||||||||||||
2005 - 2018 National Fire Incident Reporting System (NFIRS) incidents
- Incident types reported to NFIRS in Goshen, CA
- 25159.2%Fire
- 7718.2%Good Intent Call
- 6014.2%Rescue & EMS
- 245.7%Hazardous Condition
- 112.6%Service Call
- 10.2%Special Incident
- Fire incident types reported to NFIRS in Goshen, CA
- 13252.6%Outside Fires
- 6927.5%Structure Fires
- 4317.1%Mobile Property/Vehicle Fires
- 72.8%Other
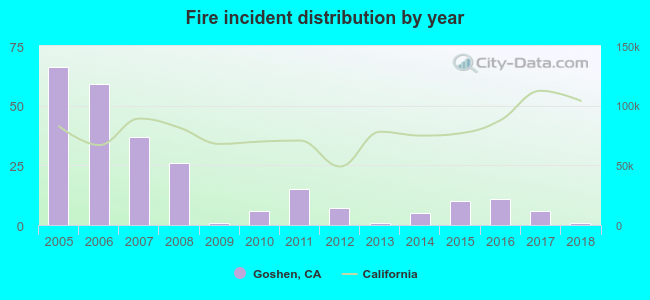 According to the data from the years 2005 - 2018 the average number of fires per year is 18. The highest number of fires - 66 took place in 2005, and the least - 1 in 2009. The data has a declining trend.
 40.6% incidents where reported in the morning and 59.4% in the evening. The most fires (19.1%) took place on Sunday, and the least (10.0%) on Thursday.
 According to the 251 fires from years 2005 - 2018 most fires (15.1%) took place during June, and the least (3.6%) in January.
 Out of all 424 cases reported during the years 2005 - 2018, the most belonged to the categories: Fire (59.2%), Service Call (18.2%), and Overpressure Rupture (14.2%).
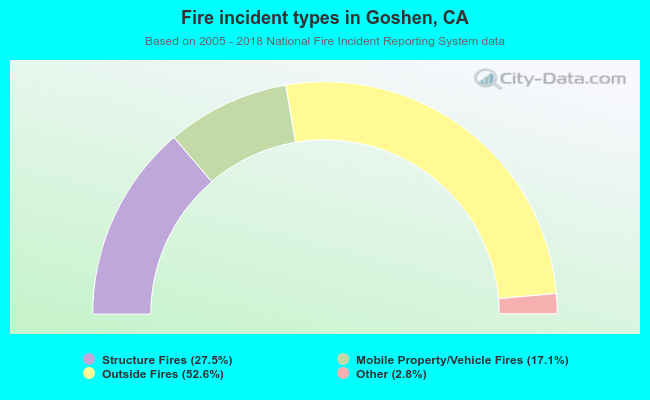 When looking into fire subcategories, the most reports belonged to: Outside Fires (52.6%), and Structure Fires (27.5%).