| Fire incidents reported |
|---|
| Sreet name | Count |
|---|
| NOTESTINE RD | 28 | | ANTWERP RD | 26 | | MAIN ST | 26 | | WITMER RD | 24 | | CUBA RD | 20 | | PAGE RD | 20 | | SCHWARTZ RD | 20 | | STATE ST | 16 | | GRABILL RD | 14 | | ROTH RD | 12 | | THIRD ST | 12 | | HURSHTOWN-SPR RD | 10 | | RICKER RD | 10 | | SAWMILL RD | 10 | | SPRINGFIELD CENTER RD | 10 | | HURSHTOWN RD | 8 | | STATE ROAD 101 RD | 8 | | BULL RAPIDS RD | 6 | | GRABER RD | 6 | | SCIPIO RD | 6 | | SURREY LN | 6 | | 14000 BLOCK SCHWARTZ RD | 4 | | 17528 CUBA | 4 | | ANTWERP-SPR RD | 4 | | BAYSHORE HEIGHTS BLVD | 4 |
| | | Fire incidents reported |
|---|
| Sreet name | Count |
|---|
| DARLING RD | 4 | | DEVALL RD | 4 | | GRABER-MIL RD | 4 | | GRABILL - SPR RD | 4 | | KLOPFENSTEIN RD | 4 | | LAKESHORE DR | 4 | | MCNABB RD | 4 | | PAGE RD | 4 | | RUPERT RD | 4 | | SOUDER RD | 4 | | SPRINGFIELD CENTER-SPR RD | 4 | | ST JOE RD | 4 | | STATE ROAD 37 - SCIPIO HWY | 4 | | STATE ROAD 37 HWY | 4 | | TRAMMEL RD | 4 | | VAN ZILE RD | 4 | | 12117 PAGE RD. | 2 | | 12529 SR 37 | 2 | | 13002 INDIANA ST | 2 | | 13101 MAIN STREET | 2 | | 13418 STATE ST | 2 | | 13430 | 2 | | 13517 THIRD ST. | 2 | | 13819 BULL RAPIDS ROAD | 2 | | |
|
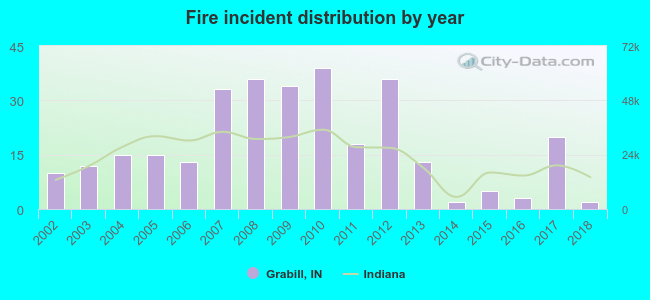 Based on the data from the years 2002 - 2018 the average number of fire incidents per year is 18. The highest number of fires - 39 took place in 2010, and the least - 2 in 2014. The data has a decreasing trend.
 30.7% incidents where reported in the morning and 69.3% in the evening. The most fires (18.0%) took place on Wednesday, and the least (9.2%) on Sunday.
 According to the 306 fire incidents from years 2002 - 2018 most fires (13.4%) took place during November, and the least (4.9%) in February.
 Out of all 812 cases reported during the years 2002 - 2018, the most belonged to the categories: Fire (37.7%), Rescue & EMS (32.9%), and Hazardous Condition (15.5%).
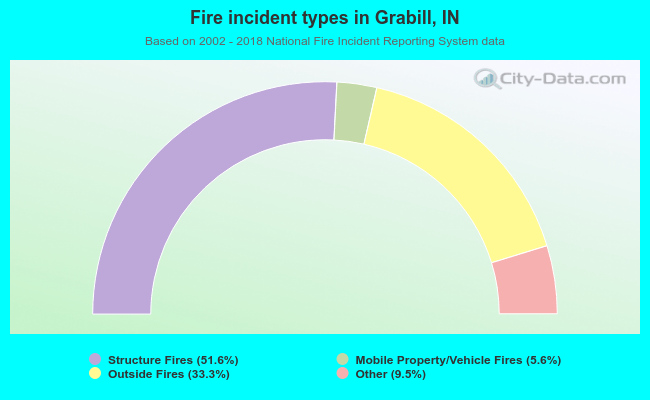 When looking into fire subcategories, the most reports belonged to: Structure Fires (51.6%), and Outside Fires (33.3%).