| Fire incidents reported |
|---|
| Sreet name | Count |
|---|
| FARM TO MARKET ROAD 1431 | 38 | | FM 1431 | 26 | | PRAIRIE CREEK | 20 | | KINGSWOOD DR | 18 | | BLUEBRIAR | 16 | | COUNTY ROAD 120 | 16 | | SUNSET DR | 16 | | VALLEY EAST LN | 14 | | CASTLELAKE | 12 | | CHURCHILL DR | 12 | | GREENBRIAR | 12 | | SUNRISE LN | 12 | | CASTLELAKE DR | 10 | | FM | 10 | | KINGS CIRCLE DR | 10 | | KINGSHILL DR | 10 | | PHILLIPS RANCH RD | 10 | | SHOREWOOD DR | 10 | | BAKER DR | 8 | | SHOREWOOD | 8 | | VALLEY WEST LN | 8 | | BRIARWAY DR | 6 | | CASTLEBERRY | 6 | | CASTLESHOALS | 6 | | FOREST DR | 6 |
| | | Fire incidents reported |
|---|
| Sreet name | Count |
|---|
| GRANITE SHOALS | 6 | | KINGSHIGH DR | 6 | | LITTLE ELM | 6 | | MYSTIC DR | 6 | | PRAIRIE CREEK RD | 6 | | SUNSET | 6 | | VALLEY EAST | 6 | | VALLEY VIEW | 6 | | VALLEY VIEW LN | 6 | | WOODLAND HILLS DR | 6 | | BAKER | 4 | | BLUEBONNET DR | 4 | | CASTLEWOOD | 4 | | CASTLEWOOD DR | 4 | | COUNTY ROAD 2342 | 4 | | COUNTY ROAD 403 | 4 | | F M 1431 | 4 | | FARM TO MARKET 1174 | 4 | | FARM TO MARKET 1431 | 4 | | FARM TO MARKET 1980 | 4 | | FM 1431 HWY | 4 | | FM 1431 W | 4 | | FM1431 | 4 | | FOREST | 4 | | |
|
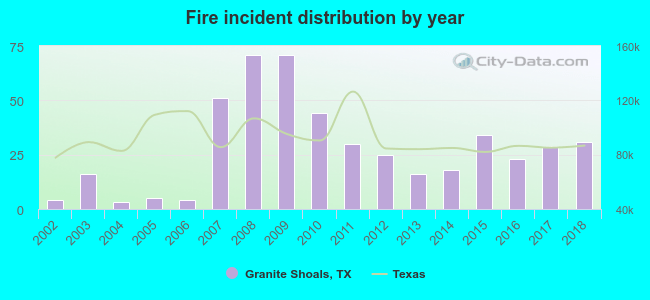 Based on the data from the years 2002 - 2018 the average number of fires per year is 28. The highest number of fire incidents - 71 took place in 2008, and the least - 3 in 2004. The data has an increasing trend.
 26.1% incidents where reported in the morning and 73.9% in the evening. The most fires (18.7%) took place on Saturday, and the least (10.1%) on Friday.
 According to the 475 fire incidents from years 2002 - 2018 most fires (10.9%) took place during January, and the least (4.6%) in November.
 Out of all 6,663 cases reported during the years 2002 - 2018, the most belonged to the categories: Good Intent Call (48.7%), Rescue & EMS (30.0%), and Service Call (8.6%).
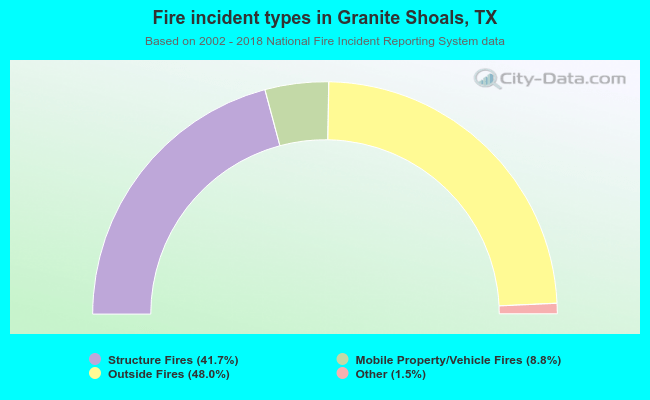 When looking into fire subcategories, the most incidents belonged to: Outside Fires (48.0%), and Structure Fires (41.7%).