| Fire incidents reported |
|---|
| Sreet name | Count |
|---|
| MASON LAKE DR | 62 | | GRAPEVIEW LOOP RD | 58 | | MASON BENSON RD | 36 | | KRABBENHOFT RD | 14 | | MURRAY RD | 14 | | GRAPEVIEW LOOP RD | 12 | | MADRONA PKY | 10 | | RAUSCHERT RD | 10 | | ANTHONY RD | 8 | | LEFFLER LOOP RD | 8 | | MASON LAKE RD | 8 | | TREASURE ISLAND DR | 8 | | CENTERLINE RD | 6 | | E MASON LAKE DR | 6 | | ECKERT RD | 6 | | GRAPVIEW LOOP RD | 6 | | ORCHID LN | 6 | | STATE ROUTE 3 | 6 | | THOMAS RD | 6 | | 21 DEA VISTA COURT | 4 | | 6543 GRAPEVIEW LOOP RD | 4 | | 760 LOMBARD N | 4 | | BENSON LAKE DR | 4 | | HARLEY DR | 4 | | HIGHWAY 3 | 4 |
| | | Fire incidents reported |
|---|
| Sreet name | Count |
|---|
| HWY 3 | 4 | | OKONEK RD | 4 | | RIVENDELL RD | 4 | | SEA VISTA | 4 | | SEA VISTA LN | 4 | | SHORE DR | 4 | | SR 3 HWY | 4 | | STRETCH ISLAND RD | 4 | | SUNNYSLOPE RD | 4 | | TRASK LK | 4 | | 100 E. ORCHARD BEACH DR. | 2 | | 111 E KEEN RD | 2 | | 1300 BLOCK OF MASON BENSON RD | 2 | | 142 PIRATES COVE RD. | 2 | | 150 E FOX RUN LN. | 2 | | 150 MURRY RD | 2 | | 150 MURRY RD. | 2 | | 189 VINEYARD | 2 | | 200 E SEA VISTA | 2 | | 200 SEA VISTA LN | 2 | | 2000 E MASON BENSON RD | 2 | | 2280 E MASON LAKE DRIVE WEST | 2 | | 2301 ANTHONY ROAD | 2 | | 231 FOX RUN | 2 | | 2380 RD | 2 |
|
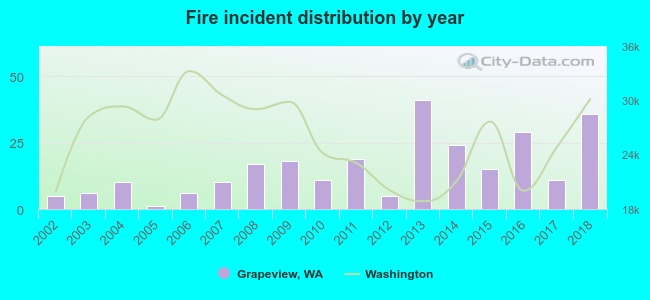 According to the data from the years 2002 - 2018 the average number of fires per year is 16. The highest number of fires - 41 took place in 2013, and the least - 1 in 2005. The data has a growing trend.
 34.5% incidents where reported in the morning and 65.5% in the evening. The most fires (23.1%) took place on Wednesday, and the least (9.5%) on Tuesday.
 According to the 264 fire incidents from years 2002 - 2018 most fires (15.2%) took place during July, and the least (4.2%) in April.
 Out of all 2,676 cases reported during the years 2002 - 2018, the most belonged to the categories: Rescue & EMS (63.8%), Service Call (13.8%), and Fire (9.9%).
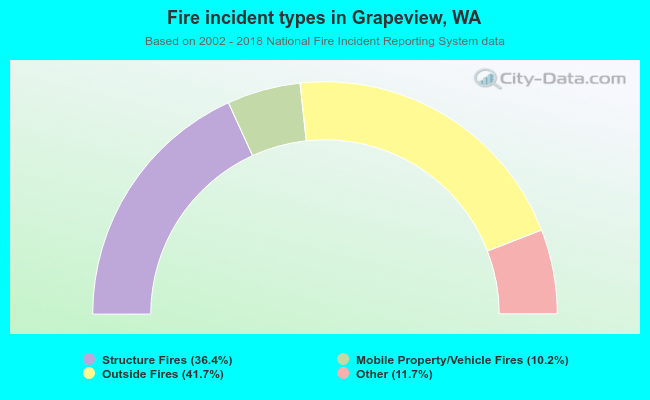 When looking into fire subcategories, the most incidents belonged to: Outside Fires (41.7%), and Structure Fires (36.4%).