Grass Lake: Fire Incidents, Michigan (MI)
Where are fire incidents reported in Grass Lake, MI
Something went wrong! Please refresh the page.
|
| |||||||||||||||||||||||||||||||||||||||||||||||||||||||||||||||||||||||||||||||||||||||||||||||||||||||||||||
2002 - 2018 National Fire Incident Reporting System (NFIRS) incidents
- Incident types reported to NFIRS in Grass Lake, MI
- 48331.9%Rescue & EMS
- 42227.9%Fire
- 31721.0%Good Intent Call
- 16310.8%Hazardous Condition
- 684.5%Service Call
- 302.0%False Alarm
- 191.3%Severe Weather
- 100.7%Special Incident
- Fire incident types reported to NFIRS in Grass Lake, MI
- 17942.4%Outside Fires
- 16639.3%Structure Fires
- 4811.4%Mobile Property/Vehicle Fires
- 296.9%Other
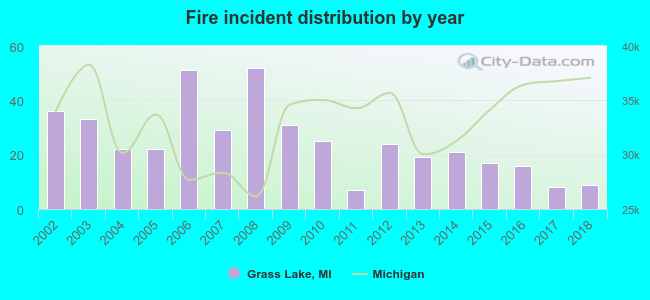 Based on the data from the years 2002 - 2018 the average number of fires per year is 25. The highest number of reported fire incidents - 52 took place in 2008, and the least - 7 in 2011. The data has a dropping trend.
 Based on the data from the years 2002 - 2018 the average number of fire-related casualties per year is 0. The highest number of reported injuries - 1 took place in 2003, and the lowest - 0 in 2002. The data has a growing trend.
 26.3% incidents where reported in the morning and 73.7% in the evening. The most fires (19.4%) took place on Wednesday, and the least (10.7%) on Thursday.
 Based on the 422 fires from years 2002 - 2018 most fires (20.6%) took place during April, and the least (4.0%) in September.
 Out of all 1,512 cases reported during the years 2002 - 2018, the most belonged to the categories: Overpressure Rupture (31.9%), Fire (27.9%), and Service Call (21.0%).
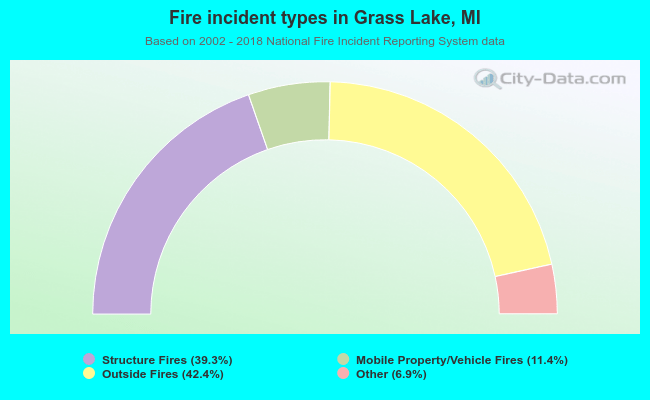 When looking into fire subcategories, the most incidents belonged to: Outside Fires (42.4%), and Structure Fires (39.3%).