| Fire incidents reported |
|---|
| Sreet name | Count |
|---|
| STATE ROUTE 105 | 48 | | STATE ROUTE 105 HWY | 48 | | SR 105 | 32 | | SR 105 HWY | 32 | | SR 105 BCH | 20 | | SCHMID RD | 18 | | BEACH FROM COUNTY LINE 2 BONGE | 10 | | CRANBERRY RD | 10 | | BEACH | 6 | | SALT AIRE BLVD | 6 | | SCHMID ROAD | 6 | | SEAMORE LN | 6 | | SMITH ANDERSON RD | 6 | | STATE RT 105 RT | 6 | | VISTA RIDGE | 6 | | WOOD LN | 6 | | CHESTER AVE | 4 | | CRANBERRY BEACH RD | 4 | | CRANBERRY ROAD | 4 | | EVERGREEN PARK RD | 4 | | GRAYLAND BEACH APPROACH | 4 | | JUNIPER ST | 4 | | MARINE DR | 4 | | OCEANO DR | 4 | | OLD STATE ROUTE 105 | 4 |
| | | Fire incidents reported |
|---|
| Sreet name | Count |
|---|
| PAPAC LANE | 4 | | PINE ST | 4 | | SANDY DRIV | 4 | | SCHMID ROAD | 4 | | SMITH ANDERSON RD | 4 | | STATE RT 105 | 4 | | TINGSTROM LN | 4 | | VISTA RIDGE DR | 4 | | 1055 SUMMERS LN | 2 | | 1101 CHESTER AVE | 2 | | 1159 SR 105 RT | 2 | | 1582 SCHMID RD | 2 | | 1633 SECOND AVE | 2 | | 2468 SR 105 | 2 | | 2739 HEATHER RD | 2 | | 2848 SR 105 | 2 | | 2848 STATE ROUTE 105 | 2 | | 2902 SR 105 | 2 | | 3633 SR 105 | 2 | | 876 TINGSTROM LN | 2 | | ASHTON AVE | 2 | | BEACH CAMP LANE | 2 | | BEACH FROM BONGE 2 COUNTY LINE | 2 | | BEACH FROM COUNTY LINE TO BONG | 2 | | BEACH NORTH OF WALSH MOTEL | 2 |
|
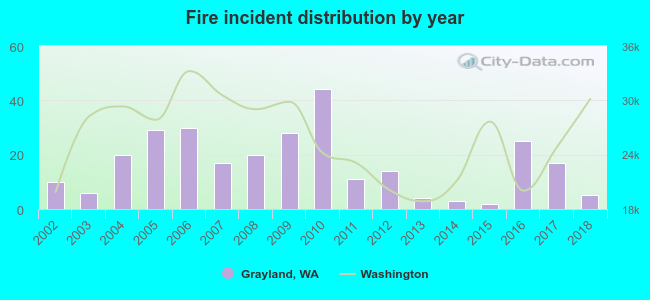 Based on the data from the years 2002 - 2018 the average number of fires per year is 17. The highest number of reported fire incidents - 44 took place in 2010, and the least - 2 in 2015. The data has a decreasing trend.
 24.9% incidents where reported in the morning and 75.1% in the evening. The most fires (19.6%) took place on Sunday, and the least (9.5%) on Thursday.
 According to the 285 incident reports from years 2002 - 2018 most fires (25.3%) took place during July, and the least (3.5%) in November.
 Out of all 1,103 cases reported during the years 2002 - 2018, the most belonged to the categories: Rescue & EMS (62.3%), Fire (25.8%), and Service Call (3.9%).
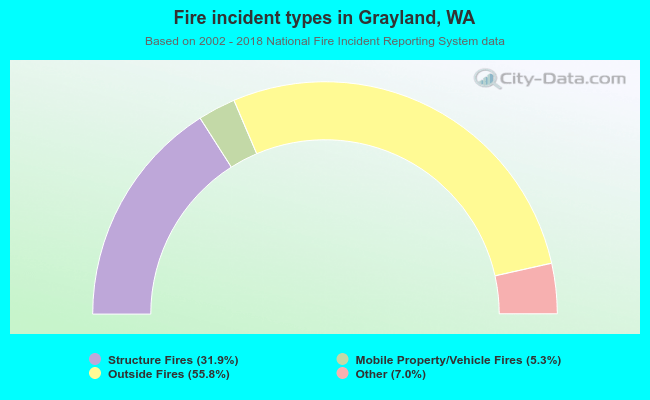 When looking into fire subcategories, the most reports belonged to: Outside Fires (55.8%), and Structure Fires (31.9%).