| Fire incidents reported |
|---|
| Sreet name | Count |
|---|
| HENDON RD | 32 | | DAYTON AVE | 26 | | BRAYTON RD | 12 | | HARRISON AVE | 12 | | PIKEVILLE AVE | 12 | | LONG STRE | 10 | | BLAINE SMITH RD | 8 | | CARTER RD | 8 | | GRAYSVILLE RD | 8 | | OLD GRAYSVILLE ROAD | 8 | | SHELTON ST | 8 | | SKILES RD. | 8 | | BLAINE SMITH RD. | 6 | | BURNETTE | 6 | | CRANMORE COVE ROAD | 6 | | GREEN RD | 6 | | MEADOWLARK TRL | 6 | | RAY HARVEY RD | 6 | | SKILES RD | 6 | | 4810 CRANMORE COVE RD. | 4 | | 512 JONES GAP ROAD | 4 | | BRAYTON MT RD | 4 | | BRAYTON MTN ROAD | 4 | | BRAYTON RD. | 4 | | BROWN RD. | 4 |
| | | Fire incidents reported |
|---|
| Sreet name | Count |
|---|
| BURNETT ST | 4 | | BURNETTE ST | 4 | | CHURCH ST | 4 | | CRANMORE COVE RD | 4 | | FOX STREET ST | 4 | | HARVEY RD. | 4 | | HENDON ROAD | 4 | | HIGHWAY 27 HWY | 4 | | LEGGETT RD | 4 | | LONG ST | 4 | | MEADOW LARK TRL | 4 | | MILLER ST | 4 | | PITTS GAP RD | 4 | | RAY GADD RD | 4 | | SIXTH STRE | 4 | | STEWART RD. | 4 | | SUZANNE RD | 4 | | 11667 HENDON RD. RDS | 2 | | 119 PIKEVILLE AVENUE | 2 | | 1656 STEWART RD. | 2 | | 173 SNYDER LOOP | 2 | | 20 SCOOTER DRIVE | 2 | | 201 HARMON ROAD RD | 2 | | 203 AQUA ST | 2 | | 205 GREEN ACRES RD. | 2 |
|
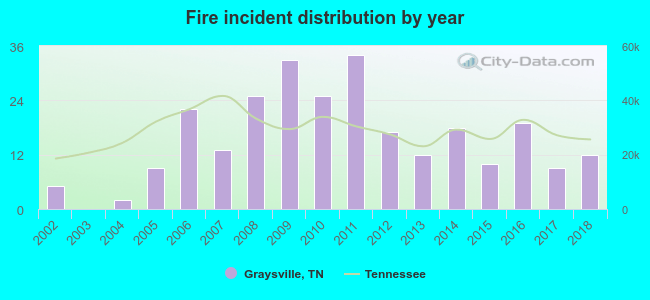 Based on the data from the years 2002 - 2018 the average number of fire incidents per year is 16. The highest number of fire incidents - 34 took place in 2011, and the least - 0 in 2003. The data has an increasing trend.
 29.8% incidents where reported in the morning and 70.2% in the evening. The most fires (21.5%) took place on Saturday, and the least (10.6%) on Monday.
 Based on the 265 reports from years 2002 - 2018 most fires (12.5%) took place during September, and the least (4.2%) in May.
 Out of all 896 cases reported during the years 2002 - 2018, the most belonged to the categories: Overpressure Rupture (52.6%), Fire (29.6%), and Rescue & EMS (9.6%).
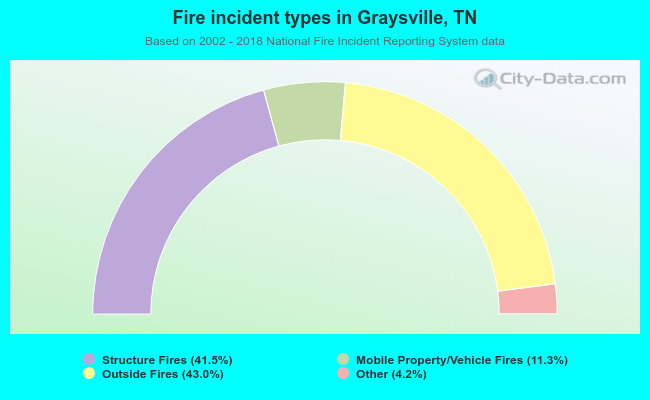 When looking into fire subcategories, the most reports belonged to: Outside Fires (43.0%), and Structure Fires (41.5%).