Great Barrington: Fire Incidents, Massachusetts (MA)
Where are fire incidents reported in Great Barrington, MA
Something went wrong! Please refresh the page.
| Fire incidents reported | |
|---|---|
| Sreet name | Count |
| MAIN ST | 706 |
| ALFORD RD | 248 |
| STOCKBRIDGE RD | 218 |
| BERNARD GIBBONS DR | 66 |
| NORTH PLAIN RD | 52 |
| STATE RD | 48 |
| CHRISTIAN HILL RD | 46 |
| DIVISION ST | 44 |
| MAPLE AVE | 40 |
| MONTEREY RD | 36 |
| WEST AVE | 34 |
| PARK ST | 32 |
| MAHAIWE ST | 30 |
| EGREMONT PLAIN RD | 26 |
| SOUTH ST | 26 |
| PLAIN RD | 24 |
| RAILROAD ST | 24 |
| BLUE HILL RD | 20 |
| HURLBURT RD | 20 |
| MONUMENT VALLEY RD | 20 |
| BRIDGE ST | 18 |
| EAST ST | 16 |
| MAHAWIE ST | 16 |
| BRUSH HILL RD | 14 |
| LONG POND RD | 14 |
| CHURCH ST | 12 |
| NORTH ST | 12 |
| SEEKONK CROSS RD | 12 |
| TACONIC AVE | 12 |
| WEST SHEFFIELD RD | 12 |
2002 - 2018 National Fire Incident Reporting System (NFIRS) incidents
- Incident types reported to NFIRS in Great Barrington, MA
- 1,22331.0%Fire
- 1,05326.7%False Alarm
- 71218.0%Hazardous Condition
- 58814.9%Rescue & EMS
- 2135.4%Service Call
- 1433.6%Good Intent Call
- 90.2%Overpressure Rupture
- 90.2%Severe Weather
- Fire incident types reported to NFIRS in Great Barrington, MA
- 96078.5%Structure Fires
- 18915.5%Outside Fires
- 554.5%Mobile Property/Vehicle Fires
- 191.6%Other
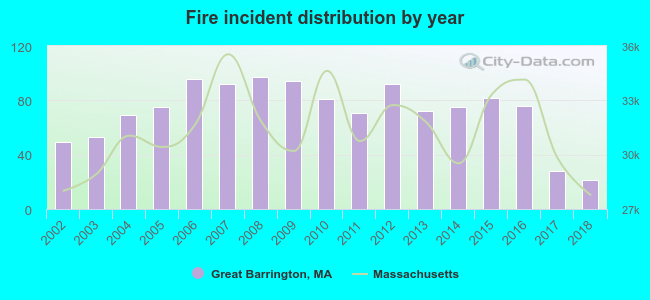 According to the data from the years 2002 - 2018 the average number of fire incidents per year is 72. The highest number of reported fire incidents - 97 took place in 2008, and the least - 21 in 2018. The data has a dropping trend.
 The median response time based on all reported fire incidents is 4 minutes. This is comparable to the state median value.
The median response time in Great Barrington, MA compared to nearest cities:
(Note: Based on data for all years, including only cities with at least 500 fire incidents)
| Great Barrington: | 4 minutes |
| Lenox: | 3 minutes |
| Pittsfield: | 5 minutes |
| Winsted: | 6 minutes |
 According to the reports from the years 2002 - 2018 the average number of fire-related yearly casualties is 1. The highest number of casualties - 6 took place in 2018, and the lowest - 0 in 2002. The data has an increasing trend.
The average number of casualties per 1,000 fires is 21. This indicator was the highest - 286 in 2018, and the lowest 0 in 2002. The trend for injuries per 1,000 fires is increasing. Compared to the state value the number of casualties per 1,000 fire incidents is lower.
According to the reports from the years 2002 - 2018 the average number of fire-related yearly casualties is 1. The highest number of casualties - 6 took place in 2018, and the lowest - 0 in 2002. The data has an increasing trend.
The average number of casualties per 1,000 fires is 21. This indicator was the highest - 286 in 2018, and the lowest 0 in 2002. The trend for injuries per 1,000 fires is increasing. Compared to the state value the number of casualties per 1,000 fire incidents is lower.Casualties per 1,000 incidents in Great Barrington, MA compared to nearest cities:
(Note: Based on data for all years, including only cities with at least 500 fire incidents)
| Great Barrington: | 8.2 |
| Lenox: | 13.4 |
| Pittsfield: | 11.1 |
| Winsted: | 0.0 |
 28.4% incidents where reported in the morning and 71.6% in the evening. The most fires (15.5%) took place on Tuesday, and the least (12.6%) on Friday.
 Based on the 1,223 fire incidents from years 2002 - 2018 most fires (14.4%) took place during April, and the least (5.7%) in June.
 Out of all 3,951 cases reported during the years 2002 - 2018, the most belonged to the categories: Fire (31.0%), False Alarm (26.7%), and Hazardous Condition (18.0%).
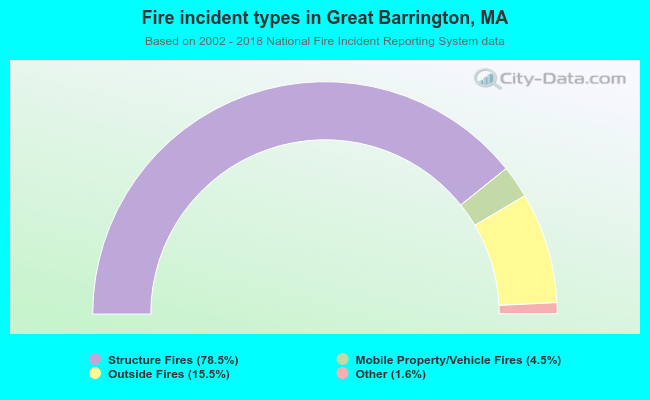 When looking into fire subcategories, the most reports belonged to: Structure Fires (78.5%), and Outside Fires (15.5%).