| Fire incidents reported |
|---|
| Sreet name | Count |
|---|
| MAIN ST | 26 | | UPPER RIDGE RD | 18 | | HOPPENVILLE RD | 16 | | GRAVEL PIKE | 14 | | WALNUT ST | 14 | | GERYVILLE PIKE | 12 | | SWAMP CREEK RD | 10 | | FINLAND RD | 8 | | CAMPBELL RD | 6 | | DOGWOOD DR | 6 | | HILL RD | 6 | | BEAN LA | 4 | | CAMP SKYMOUNT RD | 4 | | GERRYVILLE PIKE | 4 | | GREEN ST | 4 | | GREEN STREET | 4 | | HIFFLETRAYER RD | 4 | | NURSERY RD | 4 | | ZEPP RD | 4 | | 204 MAIN STREET | 2 | | 2557 GERRYVILLE PIKE | 2 | | ALLENTOWN RD | 2 | | BEAN | 2 | | BROOMSTICK RD | 2 | | CHURCH ROAD PIKE | 2 |
| | | Fire incidents reported |
|---|
| Sreet name | Count |
|---|
| DEEP CREEK RD | 2 | | DEEP CREEK SNYDER RDS | 2 | | DOGWOOD DRIVE PIKE | 2 | | GERYVILLE | 2 | | GREEN HILL DR | 2 | | HENDRICKS RD | 2 | | HILL ROAD | 2 | | HILLTOP LA | 2 | | HOPPENVILLE RD | 2 | | LOWER ROCKY DALE RD | 2 | | MAGAZINE | 2 | | MAIN | 2 | | MAIN STREET RD | 2 | | MARDON DR | 2 | | MCLEAN STATION RD | 2 | | MCLEANSTATION RD | 2 | | OAKLYNN DR | 2 | | PERKIOMENVILLE RD | 2 | | SCOTT RD | 2 | | SNYDER ROAD RD | 2 | | SWAMP CREEK RD | 2 | | UPPER ROCKY DALE RD | 2 | | WALNUT STREET | 2 | | WOODLAND RD | 2 | | |
|
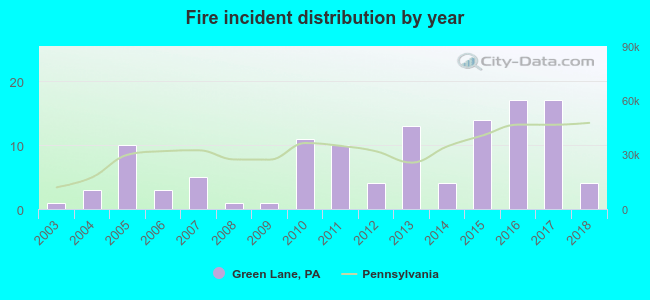 According to the data from the years 2003 - 2018 the average number of fires per year is 7. The highest number of fires - 17 took place in 2016, and the least - 1 in 2003. The data has a rising trend.
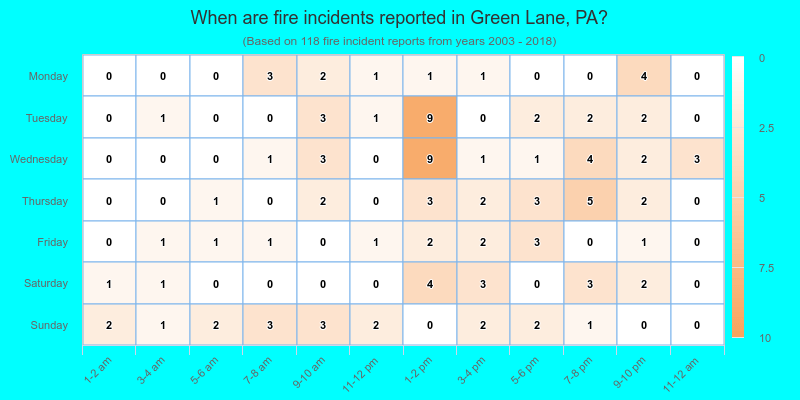
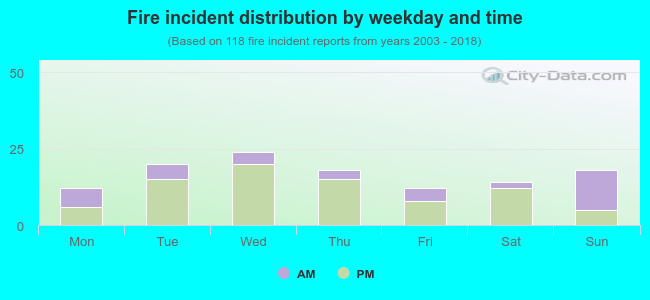 31.4% incidents where reported in the morning and 68.6% in the evening. The most fires (20.3%) took place on Wednesday, and the least (10.2%) on Monday.
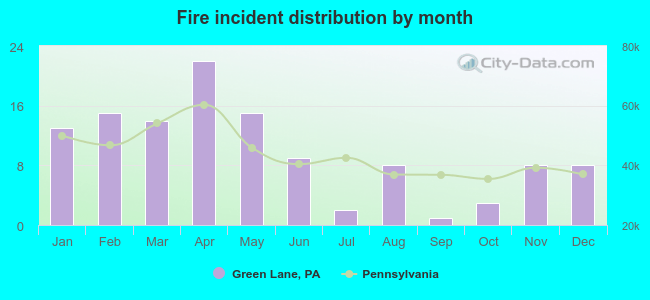 Based on the 118 fire incidents from years 2003 - 2018 most fires (18.6%) took place during April, and the least (0.8%) in September.
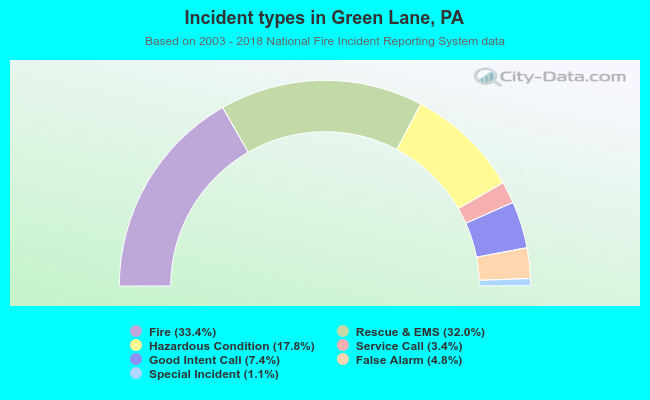 Out of all 353 cases reported during the years 2003 - 2018, the most belonged to the categories: Fire (33.4%), Overpressure Rupture (32.0%), and Rescue & EMS (17.8%).
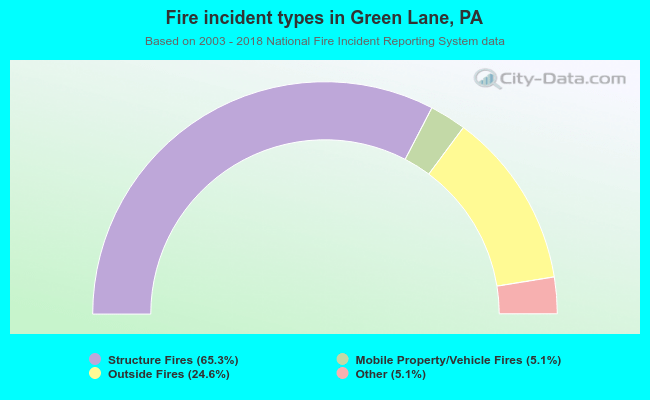 When looking into fire subcategories, the most incidents belonged to: Structure Fires (65.3%), and Outside Fires (24.6%).