| Fire incidents reported |
|---|
| Sreet name | Count |
|---|
| I8105000 LN | 18 | | WILLIAMSON (2300-5499) RD | 14 | | BUCHANAN0044005000 TRL | 12 | | CLAYHILL04001599 RD | 12 | | I81500110000 LN | 12 | | MOLLY PITCHER 1200115515 HWY | 12 | | WASHINGTON (001-640) ST | 12 | | WASHINGTON ST | 12 | | BALTIMORE (001-541) ST | 10 | | BUCHANAN (00700-03370) TRL | 10 | | FRANKLIN (001-399) ST | 10 | | WILLIAMSON23005499 RD | 10 | | ANTRIM001499 WAY | 8 | | BUCHANAN (00440-05000) TRL | 8 | | BUCHANAN TRL | 8 | | BUCHANAN0070003370 TRL | 8 | | CARLISLE ST | 8 | | KUHN70008099 RD | 8 | | PENNSYLVANIA 1575615899 AVE | 8 | | RABBIT (9100-10599) RD | 8 | | TALHELM (7000-8599) RD | 8 | | ANTRIM CHURCH(9800-11699) RD | 6 | | BALTIMORE ST | 6 | | BEMISDERFER1110011999 RD | 6 | | BROOK30003699 ST | 6 |
| | | Fire incidents reported |
|---|
| Sreet name | Count |
|---|
| BROWNSMILL (7700-9999) RD | 6 | | BUCHANAN (00440-05000) TRL | 6 | | BUCHANAN (00700-03370) TRL | 6 | | BUCHANAN TRAIL EAST | 6 | | CLAYHILL (0400-1599) RD | 6 | | COLDSMITH RD | 6 | | FLETCHER (4000-4299) DR | 6 | | FRANKLIN ST | 6 | | GRANT SHOOK1166214299 RD | 6 | | GRINDSTONE HILL RD | 6 | | GROSH38003899 DR | 6 | | HADES CHURCH 1000311799 RD | 6 | | HILL (2800-4599) RD | 6 | | HOLLOWELL CHU 1377516199 RD | 6 | | HOMESTEAD (060-115) DR | 6 | | MASON DIXON0012199 RD | 6 | | MCCLANAHAN93009999 RD | 6 | | MCDOWELL8003699 RD | 6 | | MOLLY PITCHER HWY | 6 | | RABBIT83009199 RD | 6 | | RIDGE (001-399) AVE | 6 | | RIDGE (13487-15699) RD | 6 | | SHERWOOD1460014999 DR | 6 | | TALHELM70008599 RD | 6 | | VALLEY VIEW75007899 LN | 6 |
|
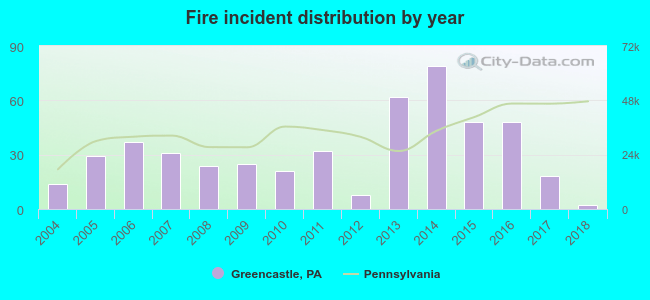 According to the data from the years 2004 - 2018 the average number of fires per year is 32. The highest number of reported fire incidents - 79 took place in 2014, and the least - 2 in 2018. The data has a declining trend.
 39.2% incidents where reported in the morning and 60.8% in the evening. The most fires (18.2%) took place on Wednesday, and the least (12.1%) on Sunday.
 Based on the 479 incident reports from years 2004 - 2018 most fires (10.9%) took place during February, and the least (5.6%) in October.
 Out of all 1,502 cases reported during the years 2004 - 2018, the most belonged to the categories: Fire (31.9%), Rescue & EMS (27.2%), and Hazardous Condition (15.8%).
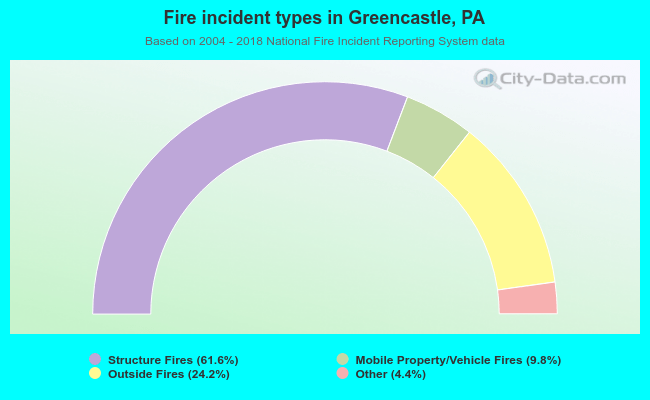 When looking into fire subcategories, the most reports belonged to: Structure Fires (61.6%), and Outside Fires (24.2%).