| Fire incidents reported |
|---|
| Sreet name | Count |
|---|
| RT. 1 | 30 | | INDUSTRIAL PARK | 14 | | HWY 39 | 8 | | DADE 81 | 6 | | E DADE 138 | 6 | | E DADE 92 | 6 | | H HIWAY | 6 | | 160 HIWAY | 4 | | 591 RT H | 4 | | CARR AND SPRING ST. | 4 | | CARR ST. | 4 | | DADE 102 | 4 | | E. DADE 126 | 4 | | GRAND | 4 | | MAPLE | 4 | | N DADE 145 | 4 | | RT 1 | 4 | | RTE CC | 4 | | STATE HWY 39 | 4 | | 01 LAZY LANE | 2 | | 103 E. DADE 114 | 2 | | 103 MITCHELL | 2 | | 104 CC HWY | 2 | | 106 N. MONTGOMERY | 2 | | 106 S. DADE 173 ROAD | 2 |
| | | Fire incidents reported |
|---|
| Sreet name | Count |
|---|
| 109 S MAIN | 2 | | 129 S STATE HWY 39 | 2 | | 13 N. ALLISON | 2 | | 156 S. ALLISON | 2 | | 160 EST TOFR 102 | 2 | | 160 HIGHWAY | 2 | | 160&39 ROAD | 2 | | 18 E DOE WALK LANE | 2 | | 185 N. DADE125 | 2 | | 190 N DADE 133 | 2 | | 2 MI E ON WATER ST | 2 | | 200 N GRAND | 2 | | 203 RT BB | 2 | | 205 SOUTHMAIN | 2 | | 207 LILLY ST | 2 | | 207 MCPHERSON | 2 | | 208 S HWY 39 | 2 | | 212 EDADE 182 | 2 | | 215 E WELLS | 2 | | 215 WELLS ST ROAD | 2 | | 219 BOISSEAU ST. | 2 | | 221 JEFFERSON ST | 2 | | 224 STATE STREET | 2 | | 236 E. DADE 138 ROAD | 2 | | |
|
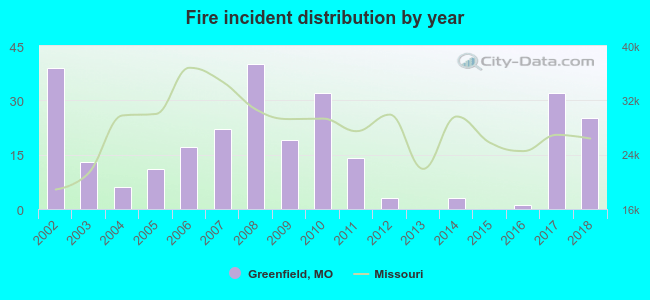 According to the data from the years 2002 - 2018 the average number of fire incidents per year is 16. The highest number of fires - 40 took place in 2008, and the least - 0 in 2013. The data has a declining trend.
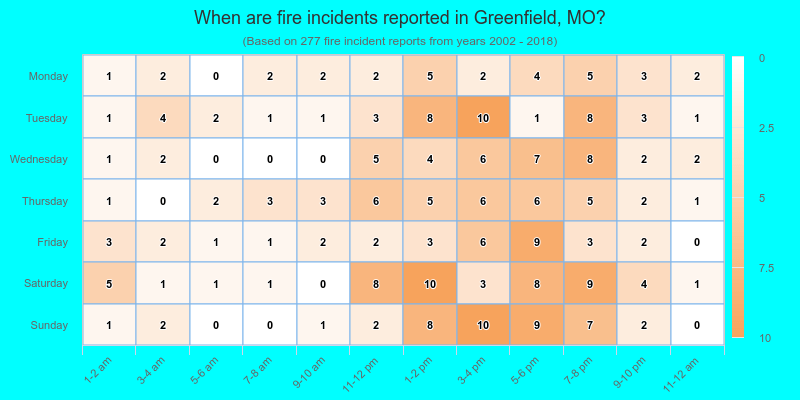
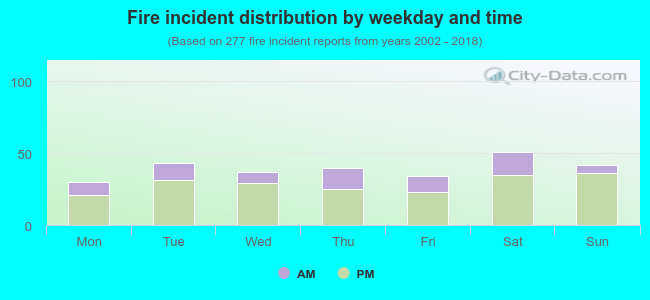 27.8% incidents where reported in the morning and 72.2% in the evening. The most fires (18.4%) took place on Saturday, and the least (10.8%) on Monday.
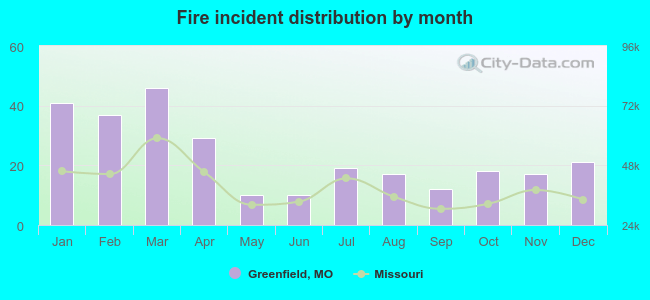 According to the 277 fires from years 2002 - 2018 most fires (16.6%) took place during March, and the least (3.6%) in May.
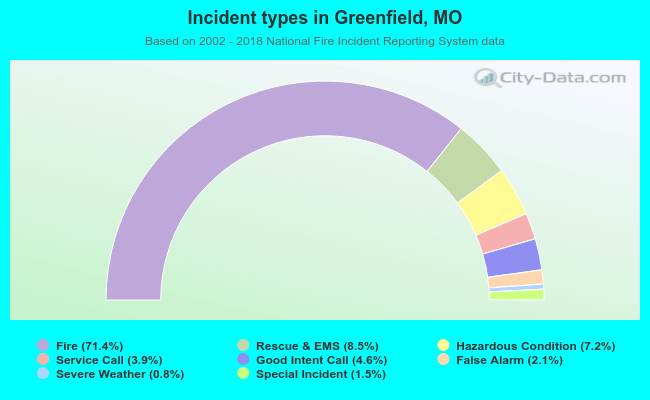 Out of all 388 cases reported during the years 2002 - 2018, the most belonged to the categories: Fire (71.4%), Overpressure Rupture (8.5%), and Rescue & EMS (7.2%).
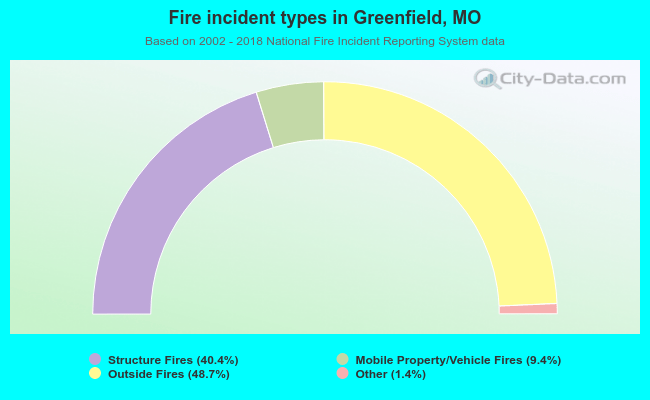 When looking into fire subcategories, the most incidents belonged to: Outside Fires (48.7%), and Structure Fires (40.4%).