| Fire incidents reported |
|---|
| Sreet name | Count |
|---|
| 205 E NEBRASKA | 8 | | GRANT AVE | 6 | | HIGHWAY 54 | 6 | | BAY | 4 | | BAY ST | 4 | | HWY 400 3MI W OF GREENSBURG | 4 | | KANSAS | 4 | | KANSAS AVE | 4 | | MAIN ST | 4 | | OLIVE ST | 4 | | SPRUCE | 4 | | SYCAMORE ST | 4 | | US 183 N AVE A | 4 | | WISCONSIN AVE | 4 | | 10170 N ST | 2 | | 10300 31ST AVE | 2 | | 11421 35TH AVE | 2 | | 120 S OLIVE | 2 | | 12384 K ST | 2 | | 14371 S OLIVE STREET | 2 | | 15000 I ST | 2 | | 160 HWY CO ROAD 22 | 2 | | 16482 183 WY | 2 | | 17193 G ST | 2 | | 17267 30TH AVE | 2 |
| | | Fire incidents reported |
|---|
| Sreet name | Count |
|---|
| 183 HWY | 2 | | 183 S O ST | 2 | | 183B STREET | 2 | | 19TH AVE. | 2 | | 20267 25TH AVE | 2 | | 25TH AVE | 2 | | 26 D ST CLARK COUNTY | 2 | | 2W 1N OF GREENSBURG | 2 | | 308 E PENNSYLVANIA ST | 2 | | 30TH AVE C ST | 2 | | 326 W MORTON | 2 | | 33 RD AVE AND I ST | 2 | | 35TH F STREET | 2 | | 35TH ST | 2 | | 39TH L ST | 2 | | 39TH ST N | 2 | | 4 MI E COMANCHEKIOWA CO LINE | 2 | | 4.5 SOUTH OF GREENSBURG ON A31 | 2 | | 411 EAST KANSAS | 2 | | 412 S SPRUCE | 2 | | 4MI W ON Q IN KIOWA CO | 2 | | 53RD ST AND G ST | 2 | | 7 S OF GREENBURG ON HWY 183 | 2 | | 9000 25TH AVE | 2 | | |
|
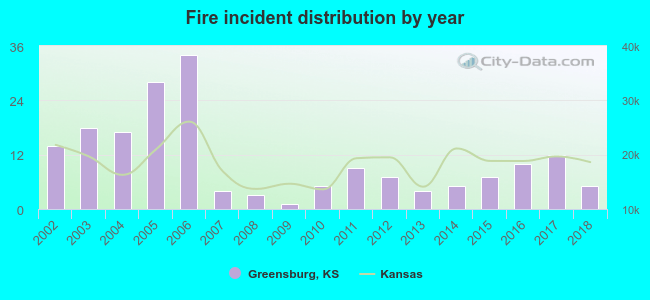 Based on the data from the years 2002 - 2018 the average number of fires per year is 11. The highest number of fires - 34 took place in 2006, and the least - 1 in 2009. The data has a dropping trend.
 18.6% incidents where reported in the morning and 81.4% in the evening. The most fires (20.8%) took place on Saturday, and the least (10.4%) on Monday.
 According to the 183 reports from years 2002 - 2018 most fires (19.7%) took place during July, and the least (2.2%) in September.
 Out of all 269 cases reported during the years 2002 - 2018, the most belonged to the categories: Fire (68.0%), Overpressure Rupture (18.2%), and Rescue & EMS (6.3%).
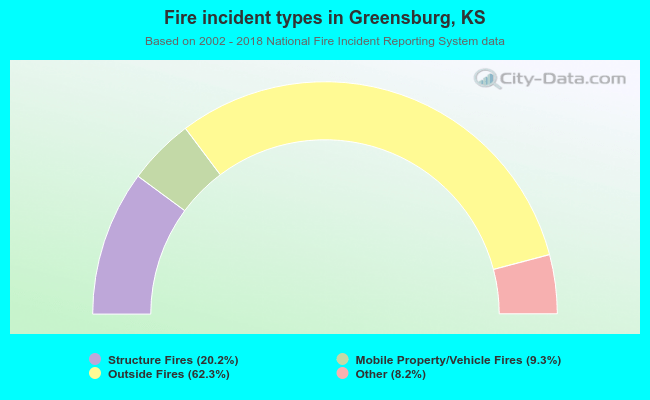 When looking into fire subcategories, the most incidents belonged to: Outside Fires (62.3%), and Structure Fires (20.2%).