| Fire incidents reported |
|---|
| Sreet name | Count |
|---|
| COUNTY RT. 113 | 26 | | NORTH RD | 22 | | MAIN ST | 16 | | STATE RT 29 | 16 | | SPRAGUETOWN RD | 14 | | STATE ROUTE 29 | 14 | | WASHINGTON ST | 12 | | BLEEKER ST | 10 | | SALEM ST | 10 | | COUNTY ROUTE 49 | 8 | | CTY RT 49 | 8 | | DERBY RD | 8 | | BUNKER HILL RD | 6 | | CHRISTIE RD | 6 | | CHURCH ST | 6 | | COUNTY RT 113 | 6 | | EDDY ST | 6 | | GREEN ST | 6 | | RABBIT RD | 6 | | SPRAGUE TOWN RD | 6 | | STATE RT. 29 | 6 | | 29 RTE | 4 | | ACADEMY ST | 4 | | ANTHONY RD | 4 | | BALD MOUNTAIN RD | 4 |
| | | Fire incidents reported |
|---|
| Sreet name | Count |
|---|
| BURTON RD | 4 | | CENTER CAMBRIDGE RD | 4 | | CLARKS MILLS RD | 4 | | COTTAGE ST | 4 | | COTTRELL RD | 4 | | COUNTY 49 RT | 4 | | COUNTY ROUTE 113 | 4 | | COUNTY RT 52 | 4 | | COUNTY RT. 70 | 4 | | FT MILLER RD | 4 | | HARTSHORNE RD | 4 | | JOHN ST | 4 | | LOCUST RD | 4 | | MEETING HOUSE RD | 4 | | OLD CAMBRIDGE RD | 4 | | POST OFFICE | 4 | | PULP MILL | 4 | | SALEM ST | 4 | | STATE RT 40 | 4 | | STATE RT. 4 | 4 | | STATE RT. 40 | 4 | | STATE RTE 40 | 4 | | STATE RTE 40 HWY | 4 | | WINDY HILL RD | 4 | | 29 | 2 |
|
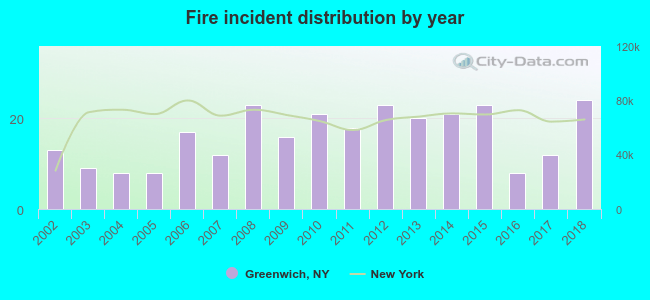 Based on the data from the years 2002 - 2018 the average number of fires per year is 16. The highest number of reported fires - 24 took place in 2018, and the least - 8 in 2004. The data has an increasing trend.
 33.0% incidents where reported in the morning and 67.0% in the evening. The most fires (19.6%) took place on Tuesday, and the least (11.2%) on Thursday.
 Based on the 276 fire incidents from years 2002 - 2018 most fires (13.8%) took place during April, and the least (4.3%) in November.
 Out of all 2,079 cases reported during the years 2002 - 2018, the most belonged to the categories: Rescue & EMS (50.3%), Hazardous Condition (21.2%), and Fire (13.3%).
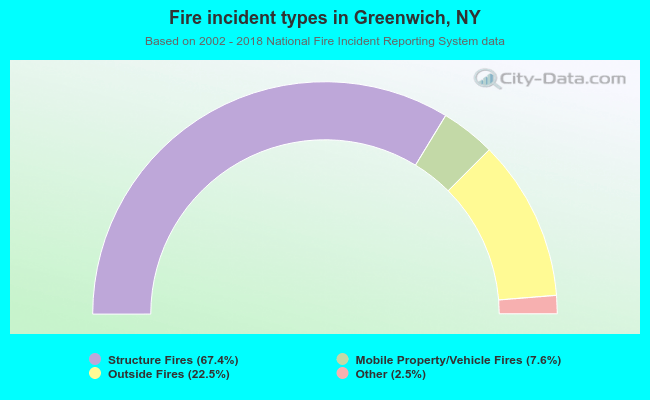 When looking into fire subcategories, the most incidents belonged to: Structure Fires (67.4%), and Outside Fires (22.5%).