Greenwich: Fire Incidents, Ohio (OH)
Where are fire incidents reported in Greenwich, OH
Something went wrong! Please refresh the page.
|
| |||||||||||||||||||||||||||||||||||||||||||||||||||||||||||||||||||||||||||||||||||||||||||||||||||||||||||||
2002 - 2018 National Fire Incident Reporting System (NFIRS) incidents
- Incident types reported to NFIRS in Greenwich, OH
- 37732.2%Rescue & EMS
- 35530.3%Hazardous Condition
- 27023.1%Fire
- 796.7%Service Call
- 413.5%Good Intent Call
- 363.1%False Alarm
- 50.4%Overpressure Rupture
- 50.4%Special Incident
- 30.3%Severe Weather
- Fire incident types reported to NFIRS in Greenwich, OH
- 15958.9%Structure Fires
- 7327.0%Outside Fires
- 3312.2%Mobile Property/Vehicle Fires
- 51.9%Other
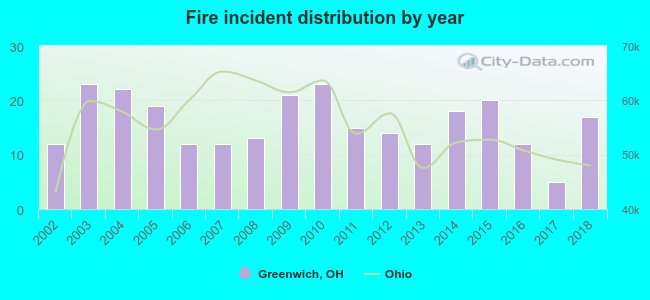 Based on the data from the years 2002 - 2018 the average number of fire incidents per year is 16. The highest number of reported fire incidents - 23 took place in 2003, and the least - 5 in 2017. The data has an increasing trend.
 Based on the data from the years 2002 - 2018 the average number of fire-related yearly casualties is 0. The highest number of reported injuries - 2 took place in 2004, and the lowest - 0 in 2002. The data has a constant trend.
 34.8% incidents where reported in the morning and 65.2% in the evening. The most fires (19.3%) took place on Saturday, and the least (8.5%) on Thursday.
 Based on the 270 incident reports from years 2002 - 2018 most fires (14.1%) took place during April, and the least (4.1%) in May.
 Out of all 1,171 cases reported during the years 2002 - 2018, the most belonged to the categories: Rescue & EMS (32.2%), Hazardous Condition (30.3%), and Fire (23.1%).
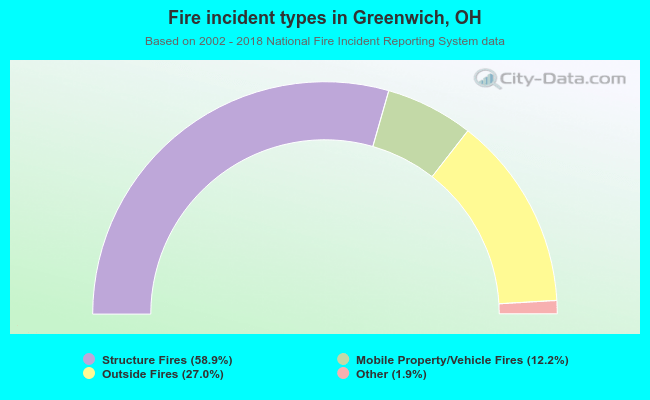 When looking into fire subcategories, the most incidents belonged to: Structure Fires (58.9%), and Outside Fires (27.0%).