| Fire incidents reported |
|---|
| Sreet name | Count |
|---|
| GREENWOOD RD | 112 | | INTERSTATE 20 | 50 | | INTERSTATE 20 W | 40 | | HWY 80 | 34 | | GOLDEN MEADOWS RD | 20 | | HWY 79 | 20 | | INTERSTATE 20 E | 18 | | WINBURN DR | 18 | | SATINWOOD DR | 16 | | BEA LN | 14 | | BEEBE DR | 12 | | ADAMS LN | 10 | | GREENWOOD RD | 10 | | NIXON ST | 10 | | SCOTT DR | 10 | | STARWOOD LN | 10 | | 70TH ST | 8 | | WATERWOOD DR | 8 | | GREENWOOD HEIGHTS ST | 6 | | GREENWOODSPRINGRIDGE RD | 6 | | JOPPA ST | 6 | | LOCUST HILL RD | 6 | | MCGEE RD | 6 | | MONCRIEF LN | 6 | | ODOM RD | 6 |
| | | Fire incidents reported |
|---|
| Sreet name | Count |
|---|
| SOPHIE LN | 6 | | ARROW WOOD DR | 4 | | BLAKE ST | 4 | | CENTENNIAL DR | 4 | | COUNTY ROAD 329 | 4 | | DAKOTA HUSE LN | 4 | | GREENWOOD-MOORINGSPO RD | 4 | | GREENWOOD-SPRINGRIDG RD | 4 | | HOWELL ST | 4 | | JEFFERSON PAIGE RD | 4 | | KIMBERLY RD | 4 | | KIMBERLY RD | 4 | | LAUREL RIDGE DR | 4 | | LOCUST HILL RD | 4 | | NEBO ST | 4 | | SHIRLEY FRANCIS RD | 4 | | SHIRLEY FRANCIS RD | 4 | | W 70TH ST | 4 | | WOODLANDS | 4 | | BEAVERS NEST DR | 2 | | BETHANY STATE LINE RD | 2 | | BLAKE ST | 2 | | BOIS DARC LN | 2 | | BROOK STONE DR | 2 | | CHERRY RIDGE BLVD | 2 |
|
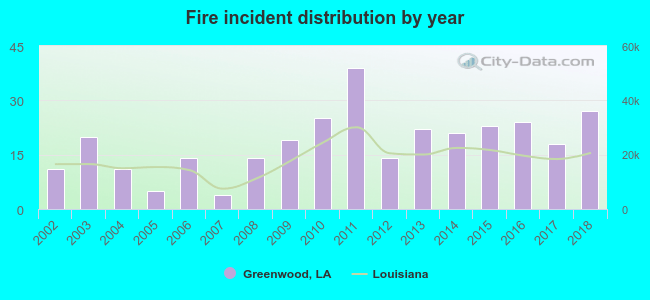 Based on the data from the years 2002 - 2018 the average number of fire incidents per year is 18. The highest number of fire incidents - 39 took place in 2011, and the least - 4 in 2007. The data has an increasing trend.
 25.1% incidents where reported in the morning and 74.9% in the evening. The most fires (15.8%) took place on Monday, and the least (13.5%) on Wednesday.
 Based on the 311 fire incidents from years 2002 - 2018 most fires (11.6%) took place during June, and the least (4.5%) in December.
 Out of all 3,084 cases reported during the years 2002 - 2018, the most belonged to the categories: Rescue & EMS (66.9%), Good Intent Call (13.4%), and Fire (10.1%).
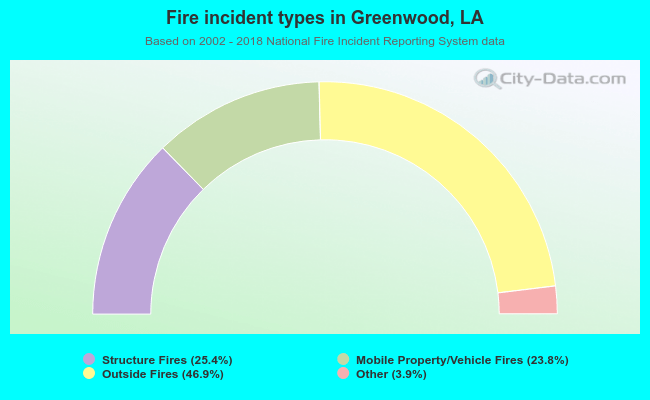 When looking into fire subcategories, the most reports belonged to: Outside Fires (46.9%), and Structure Fires (25.4%).