| Fire incidents reported |
|---|
| Sreet name | Count |
|---|
| MAIN | 12 | | US 160 HWY | 10 | | 150 DOVE RD | 6 | | BLACKJACK AND RD 8 | 6 | | HWY 160 | 6 | | RD 7 AND FLINT | 6 | | ROAD 4 | 6 | | ROAD 7 | 6 | | 212 N. WALNUT | 4 | | 312 S. MAIN | 4 | | 681 CYCLONE | 4 | | 736 EVERGREEN | 4 | | 808 CYCLONE | 4 | | EVERGREEN | 4 | | EVERGREEN ROAD | 4 | | FLINT AND RD 4 | 4 | | HWY 160 AND RD 8 | 4 | | HWY 160 RD | 4 | | RD 9 AND EVERGREEN | 4 | | 1501 RD 8 | 2 | | 1541 ANGUS | 2 | | 1968 RD 7 | 2 | | 251 RD 3 | 2 | | 288 CYCLONE RD | 2 | | 300 BLACKJACK | 2 |
| | | Fire incidents reported |
|---|
| Sreet name | Count |
|---|
| 325 S MAIN | 2 | | 491 BLACKJACK RD | 2 | | 674 FLINT | 2 | | 7 | 2 | | 7 AND FLINT | 2 | | 731 EVERGREEN | 2 | | 765 ROAD 8 | 2 | | 811 W MUBERRY | 2 | | 811 W MULBERRY | 2 | | 871 CYCLONE | 2 | | ANGUS AND ROAD 22 | 2 | | ANGUS AND ROAD 3 | 2 | | ANGUS AND ROAD 3 RD | 2 | | BLACKJACK AND RD 5 | 2 | | BLACKJACK RD | 2 | | CANA | 2 | | CHAUTAUQUA COUNTY | 2 | | EVERGREEN AND RD 11 | 2 | | EVERGREEN RD | 2 | | EVERGREEN RD | 2 | | FLINT ROAD | 2 | | HICKORY | 2 | | HWY 160 AND ROAD 10 RD | 2 | | HWY 160 AND ROAD 7 | 2 | | |
|
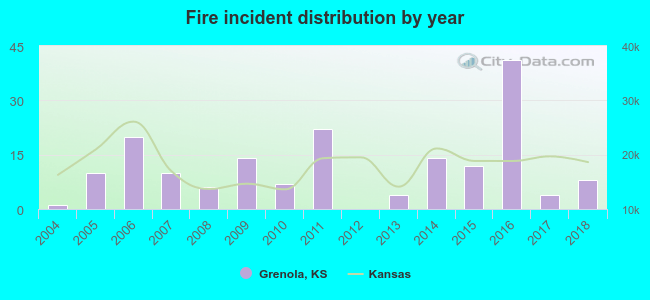 Based on the data from the years 2004 - 2018 the average number of fires per year is 12. The highest number of fires - 41 took place in 2016, and the least - 0 in 2012. The data has a growing trend.
 23.1% incidents where reported in the morning and 76.9% in the evening. The most fires (18.5%) took place on Saturday, and the least (9.2%) on Monday.
 According to the 173 reports from years 2004 - 2018 most fires (23.7%) took place during March, and the least (0.0%) in September.
 Out of all 204 cases reported during the years 2004 - 2018, the most belonged to the categories: Fire (84.8%), Service Call (7.8%), and Overpressure Rupture (4.9%).
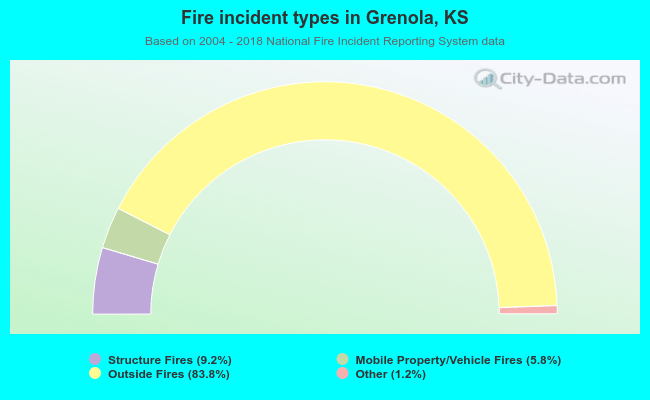 When looking into fire subcategories, the most incidents belonged to: Outside Fires (83.8%), and Structure Fires (9.2%).