Grimes: Fire Incidents, California (CA)
Where are fire incidents reported in Grimes, CA
Something went wrong! Please refresh the page.
|
| |||||||||||||||||||||||||||||||||||||||||||||||||||||||||
| Other | 46 | |||||||||||||||||||||||||||||||||||||||||||||||||||||||||
2005 - 2018 National Fire Incident Reporting System (NFIRS) incidents
- Incident types reported to NFIRS in Grimes, CA
- 19857.9%Fire
- 7722.5%Rescue & EMS
- 308.8%Hazardous Condition
- 216.1%Good Intent Call
- 154.4%Service Call
- 10.3%False Alarm
- Fire incident types reported to NFIRS in Grimes, CA
- 15377.3%Outside Fires
- 2412.1%Mobile Property/Vehicle Fires
- 2010.1%Structure Fires
- 10.5%Other
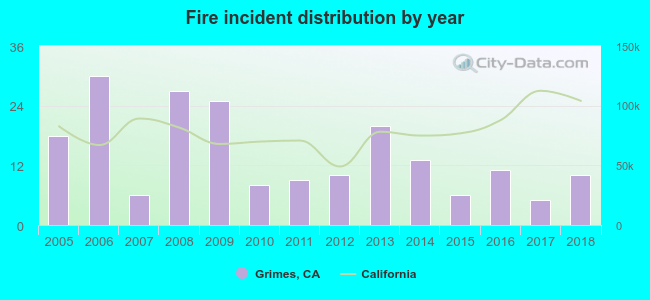 According to the data from the years 2005 - 2018 the average number of fires per year is 14. The highest number of fire incidents - 30 took place in 2006, and the least - 5 in 2017. The data has a decreasing trend.
 20.7% incidents where reported in the morning and 79.3% in the evening. The most fires (18.2%) took place on Friday, and the least (11.6%) on Saturday.
 Based on the 198 reports from years 2005 - 2018 most fires (17.2%) took place during October, and the least (1.0%) in December.
 Out of all 342 cases reported during the years 2005 - 2018, the most belonged to the categories: Fire (57.9%), Overpressure Rupture (22.5%), and Rescue & EMS (8.8%).
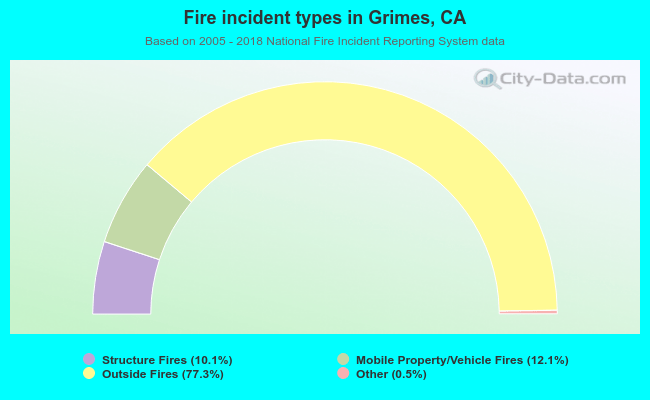 When looking into fire subcategories, the most reports belonged to: Outside Fires (77.3%), and Mobile Property/Vehicle Fires (12.1%).