Grosse Pointe Woods: Fire Incidents, Michigan (MI)
Where are fire incidents reported in Grosse Pointe Woods, MI
Something went wrong! Please refresh the page.
|
| |||||||||||||||||||||||||||||||||||||||||||||||||||||||||||||||||||||||||||||||||||||||||||||||||||||||||||||
2002 - 2018 National Fire Incident Reporting System (NFIRS) incidents
- Incident types reported to NFIRS in Grosse Pointe Woods, MI
- 70836.6%Hazardous Condition
- 39520.4%Fire
- 38219.7%False Alarm
- 28314.6%Rescue & EMS
- 1055.4%Service Call
- 542.8%Good Intent Call
- 40.2%Overpressure Rupture
- 40.2%Special Incident
- 20.1%Severe Weather
- Fire incident types reported to NFIRS in Grosse Pointe Woods, MI
- 20451.6%Structure Fires
- 7118.0%Other
- 6717.0%Outside Fires
- 5313.4%Mobile Property/Vehicle Fires
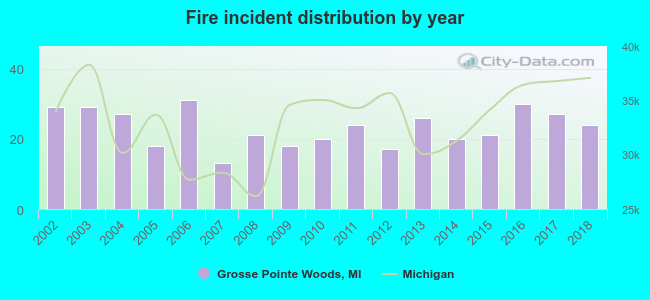 According to the data from the years 2002 - 2018 the average number of fires per year is 23. The highest number of reported fires - 31 took place in 2006, and the least - 13 in 2007. The data has a dropping trend.
The average number of yearly fire incidents per 10k residents in Grosse Pointe Woods, MI compared to nearest cities:
(Note: Based on data for the last 3 years, including only cities with population 5,000 and above)
| Grosse Pointe Woods: | 17.1 |
| Harper Woods: | 17.7 |
| Grosse Pointe Farms: | 14.0 |
| Grosse Pointe: | 5.7 |
| Eastpointe: | 32.2 |
| Grosse Pointe Park: | 13.0 |
| Roseville: | 29.2 |
| Center Line: | 78.6 |
| Fraser: | 15.7 |
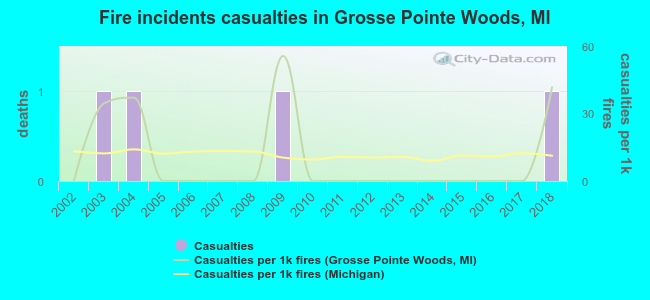 According to the data from the years 2002 - 2018 the average number of fire-related yearly casualties is 0. The highest number of injuries - 1 took place in 2003, and the lowest - 0 in 2002. The data has a growing trend.
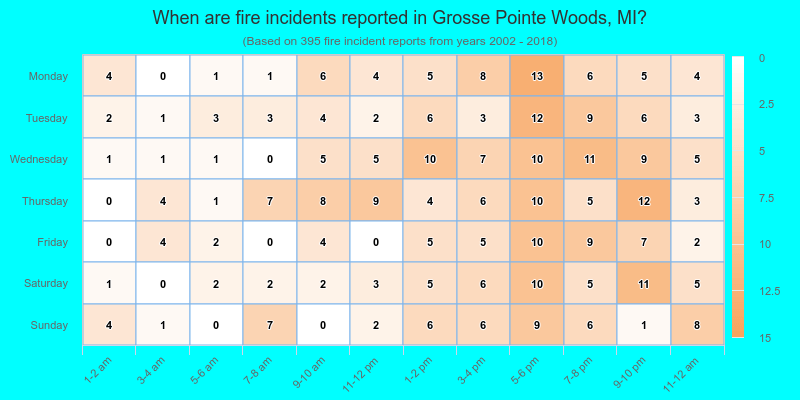
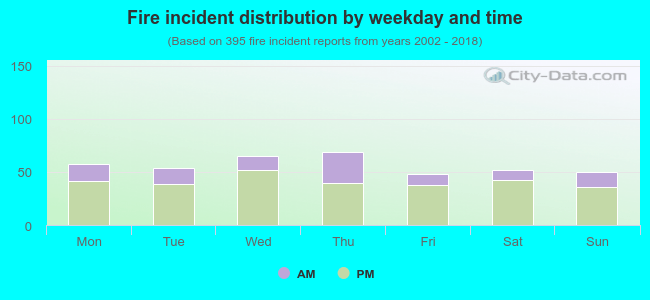 27.1% incidents where reported in the morning and 72.9% in the evening. The most fires (17.5%) took place on Thursday, and the least (12.2%) on Friday.
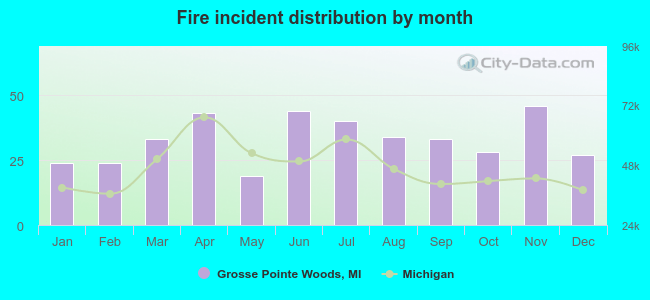 Based on the 395 fire incident reports from years 2002 - 2018 most fires (11.6%) took place during November, and the least (4.8%) in May.
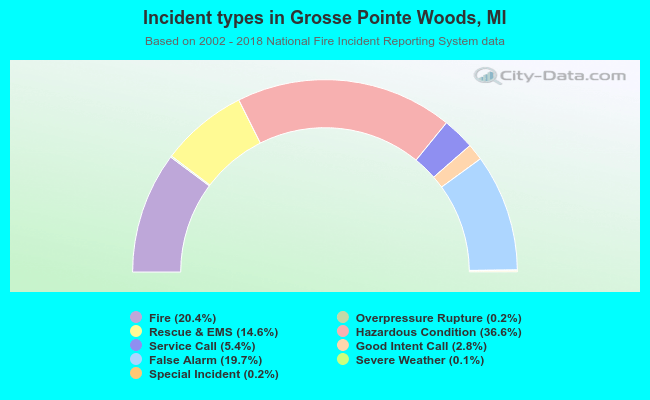 Out of all 1,937 cases reported during the years 2002 - 2018, the most belonged to the categories: Hazardous Condition (36.6%), Fire (20.4%), and False Alarm (19.7%).
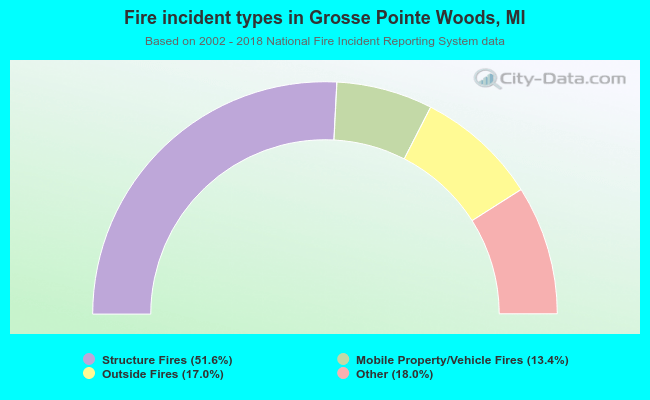 When looking into fire subcategories, the most incidents belonged to: Structure Fires (51.6%), and Other (18.0%).