| Fire incidents reported |
|---|
| Sreet name | Count |
|---|
| PLEASANT VALLEY RD | 40 | | LICK ST | 34 | | OLD STAGE RD | 32 | | PERU RD | 22 | | ELM ST | 18 | | GROTON RD | 16 | | MAIN ST | 16 | | CHIPMAN CORNERS RD | 14 | | CORTLAND RD | 14 | | OLD PERUVILLE RD | 14 | | PLEASANT VALLEY RD | 14 | | SOVOCOOL HILL RD | 14 | | STEVENS RD | 14 | | CLARK ST EXT | 12 | | CORTLAND ST | 12 | | OLD STAGE RD | 12 | | COBB ST | 10 | | CORTLAND ST | 10 | | PERUVILLE RD | 10 | | SPRING ST EXT | 10 | | CLARK ST | 8 | | LOCKE RD | 8 | | PERUVILLE ROAD | 8 | | SPRING ST | 8 | | E CORTLAND ST | 6 |
| | | Fire incidents reported |
|---|
| Sreet name | Count |
|---|
| LOCKE RD | 6 | | OLD PERUVILLE | 6 | | PASADENA AVE | 6 | | SMITH RD | 6 | | SOUTH ST | 6 | | STEVENS ROAD | 6 | | 222 | 4 | | CAYUGA ST | 4 | | CHAMPLIN RD | 4 | | CHAMPLIN RD | 4 | | CHURCH ST | 4 | | CLARK ST EXT | 4 | | CORTLAND RD | 4 | | CORTLAND ROAD | 4 | | EAST CORTLAND ST | 4 | | ELM ST | 4 | | ELM ST EXT | 4 | | ELMWOOD AVE | 4 | | LICK ST | 4 | | LINCOLN AVE | 4 | | MCLEAN CORTLAND RD | 4 | | NEWMAN RD | 4 | | PLEASANT VALLEY ROAD | 4 | | ROOSEVELT AVE | 4 | | |
|
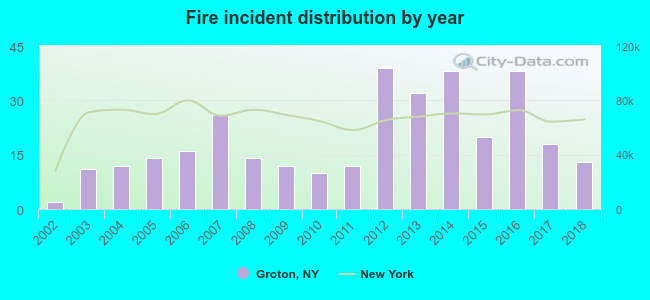 Based on the data from the years 2002 - 2018 the average number of fires per year is 19. The highest number of reported fires - 39 took place in 2012, and the least - 2 in 2002. The data has an increasing trend.
 26.6% incidents where reported in the morning and 73.4% in the evening. The most fires (18.0%) took place on Sunday, and the least (10.4%) on Friday.
 Based on the 327 fire incidents from years 2002 - 2018 most fires (24.5%) took place during April, and the least (4.3%) in October.
 Out of all 4,122 cases reported during the years 2002 - 2018, the most belonged to the categories: Rescue & EMS (67.0%), Fire (7.9%), and Service Call (7.1%).
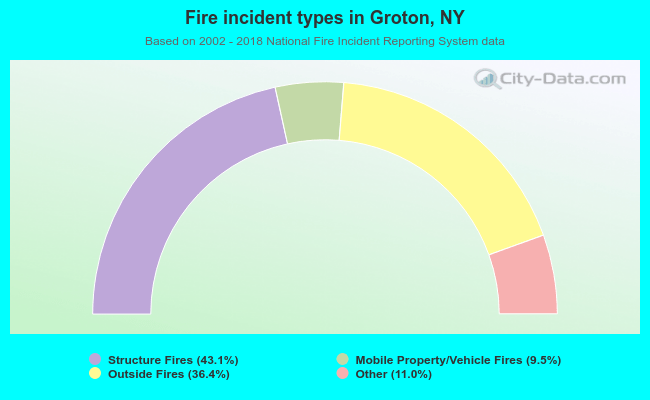 When looking into fire subcategories, the most incidents belonged to: Structure Fires (43.1%), and Outside Fires (36.4%).