| Fire incidents reported |
|---|
| Sreet name | Count |
|---|
| STONE COAL | 20 | | SLATE CREEK RD | 16 | | LITTLE PRATER | 10 | | HALE CREEK RD | 8 | | 2063 EDGEWATER DR | 6 | | KEEN RIDGE RD | 6 | | LOCUST RD | 6 | | PANTHER RIDGE RD | 6 | | POPLAR CREEK ROAD | 6 | | RT 460 | 6 | | SLATE CREEK RD | 6 | | SMITH BRANCH RD | 6 | | WEST 460 | 6 | | 1063 HAZELNUT RD | 4 | | 2485 BULL CRK RD | 4 | | 6 20 MILE BRANCH ROAD | 4 | | CRYSTAL BALL RD | 4 | | FRONT LANE ROAD | 4 | | HOOTOWL RD. | 4 | | KEEN RIDGE RD | 4 | | LOONEYS CREEK | 4 | | PATTERSON RD | 4 | | POPULAR CREEK | 4 | | POPULAR CREEK ROAD | 4 | | RIVERSIDE DR | 4 |
| | | Fire incidents reported |
|---|
| Sreet name | Count |
|---|
| RT 701 SMITH BRANCH RD | 4 | | RT 83 | 4 | | RT. 460 | 4 | | RT. 460 BELOW GRUNDY | 4 | | SLATE CREEK | 4 | | SLATE CREEK RD RD | 4 | | SUNFLOWER RD | 4 | | 1023 HERTIAGE CIRCLE CIR | 2 | | 1025 WONDERLAND ROAD | 2 | | 1047 | 2 | | 1047 CYPHERS ST ST | 2 | | 1051 CHARLES RD | 2 | | 1055 TALL WOOD RD | 2 | | 1072 TALLWOOD RD | 2 | | 1089 HILLVIEW DRIVE | 2 | | 1108 MILKWEED RD | 2 | | 1111 RIVERSIDE DRIVE HWY | 2 | | 1122 BURNT TREE RD | 2 | | 11448 SLATE CREEK RD | 2 | | 11478 SLATE CREEK RD | 2 | | 1156 DAVIS FK | 2 | | 1161 LOONY CREEK ROAD | 2 | | 1164 DRYFORK RD RD | 2 | | 1170 GLASIER RD | 2 | | |
|
 According to the data from the years 2004 - 2018 the average number of fire incidents per year is 21. The highest number of reported fire incidents - 50 took place in 2010, and the least - 3 in 2015. The data has a decreasing trend.
 28.9% incidents where reported in the morning and 71.1% in the evening. The most fires (20.3%) took place on Saturday, and the least (9.6%) on Thursday.
 Based on the 311 incident reports from years 2004 - 2018 most fires (23.2%) took place during April, and the least (3.5%) in July.
 Out of all 479 cases reported during the years 2004 - 2018, the most belonged to the categories: Fire (64.9%), Rescue & EMS (18.8%), and Overpressure Rupture (6.1%).
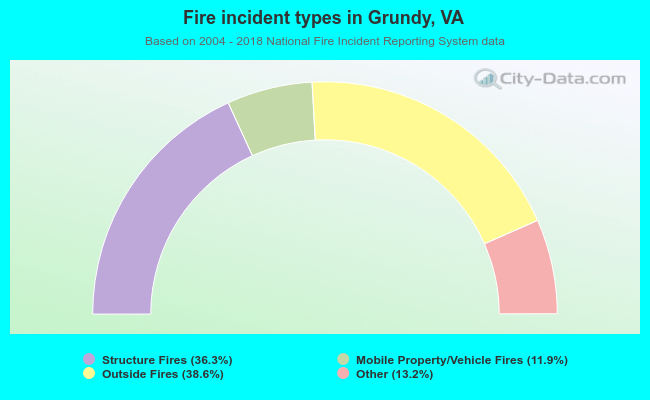 When looking into fire subcategories, the most reports belonged to: Outside Fires (38.6%), and Structure Fires (36.3%).