Guerneville: Fire Incidents, California (CA)
Where are fire incidents reported in Guerneville, CA
Something went wrong! Please refresh the page.
|
| |||||||||||||||||||||||||||||||||||||||||||||||||||||||||||||||||||||||||||||||||||||||||||||||||||||||||||||
2005 - 2018 National Fire Incident Reporting System (NFIRS) incidents
- Incident types reported to NFIRS in Guerneville, CA
- 26147.0%Fire
- 9917.8%Hazardous Condition
- 7814.1%Good Intent Call
- 6010.8%False Alarm
- 366.5%Service Call
- 203.6%Rescue & EMS
- 10.2%Special Incident
- Fire incident types reported to NFIRS in Guerneville, CA
- 16161.7%Outside Fires
- 7629.1%Structure Fires
- 135.0%Other
- 114.2%Mobile Property/Vehicle Fires
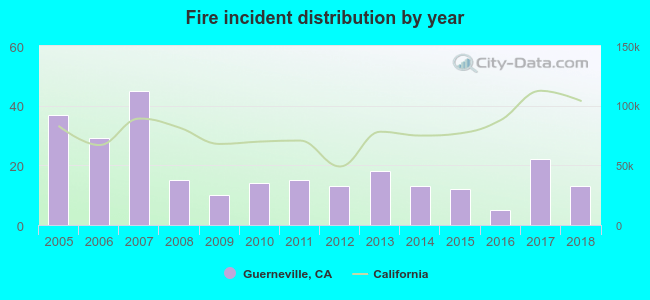 According to the data from the years 2005 - 2018 the average number of fires per year is 19. The highest number of fire incidents - 45 took place in 2007, and the least - 5 in 2016. The data has a decreasing trend.
 37.2% incidents where reported in the morning and 62.8% in the evening. The most fires (15.7%) took place on Friday, and the least (12.3%) on Wednesday.
 Based on the 261 reports from years 2005 - 2018 most fires (14.2%) took place during July, and the least (3.1%) in February.
 Out of all 555 cases reported during the years 2005 - 2018, the most belonged to the categories: Fire (47.0%), Rescue & EMS (17.8%), and Service Call (14.1%).
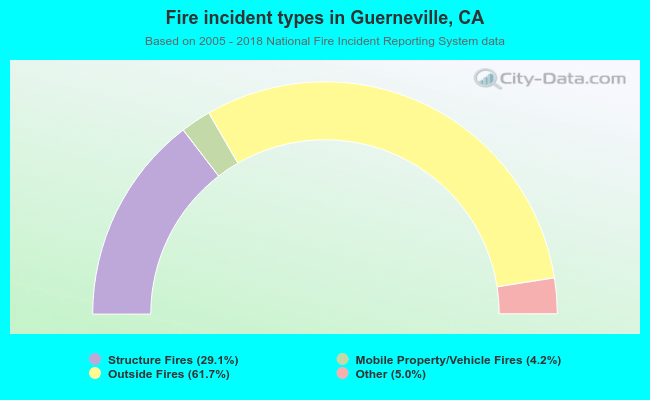 When looking into fire subcategories, the most reports belonged to: Outside Fires (61.7%), and Structure Fires (29.1%).