Guilford: Fire Incidents, New York (NY)
Where are fire incidents reported in Guilford, NY
Something went wrong! Please refresh the page.
|
| |||||||||||||||||||||||||||||||||||||||||||||||||||||||||||||||||||||||||||||||||||||||||
2003 - 2018 National Fire Incident Reporting System (NFIRS) incidents
- Incident types reported to NFIRS in Guilford, NY
- 21755.4%Rescue & EMS
- 10125.8%Fire
- 338.4%Hazardous Condition
- 215.4%Good Intent Call
- 102.6%False Alarm
- 61.5%Severe Weather
- 20.5%Overpressure Rupture
- 20.5%Service Call
- Fire incident types reported to NFIRS in Guilford, NY
- 5251.5%Structure Fires
- 2423.8%Outside Fires
- 1413.9%Mobile Property/Vehicle Fires
- 1110.9%Other
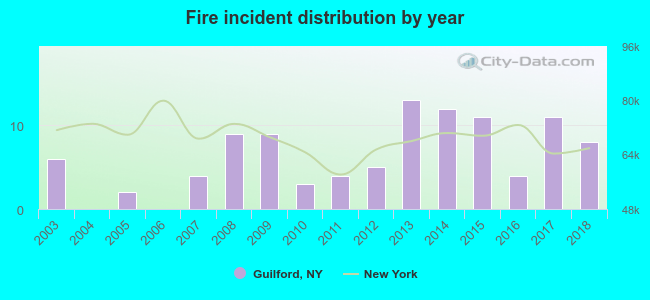 According to the data from the years 2003 - 2018 the average number of fire incidents per year is 6. The highest number of fires - 13 took place in 2013, and the least - 0 in 2004. The data has an increasing trend.
 49.5% incidents where reported in the morning and 50.5% in the evening. The most fires (27.7%) took place on Tuesday, and the least (6.9%) on Wednesday.
 Based on the 101 incident reports from years 2003 - 2018 most fires (25.7%) took place during April, and the least (2.0%) in August.
 Out of all 392 cases reported during the years 2003 - 2018, the most belonged to the categories: Rescue & EMS (55.4%), Fire (25.8%), and Hazardous Condition (8.4%).
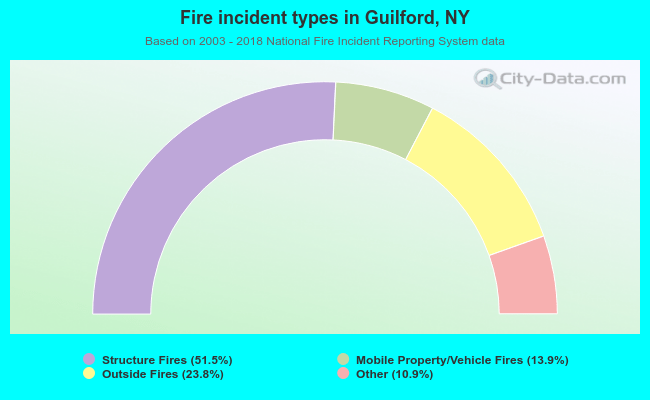 When looking into fire subcategories, the most incidents belonged to: Structure Fires (51.5%), and Outside Fires (23.8%).