Gwinner: Fire Incidents, North Dakota (ND)
Where are fire incidents reported in Gwinner, ND
Something went wrong! Please refresh the page.
|
| |||||||||||||||||||||||||||||||||||||||||||||||||||||||||||||||||||||||||||||||||||||||||||||||||||||||||
2002 - 2018 National Fire Incident Reporting System (NFIRS) incidents
- Incident types reported to NFIRS in Gwinner, ND
- 12875.3%Fire
- 137.6%Special Incident
- 105.9%Hazardous Condition
- 74.1%Rescue & EMS
- 63.5%Good Intent Call
- 31.8%False Alarm
- 21.2%Service Call
- 10.6%Overpressure Rupture
- Fire incident types reported to NFIRS in Gwinner, ND
- 6046.9%Structure Fires
- 2821.9%Outside Fires
- 2418.8%Mobile Property/Vehicle Fires
- 1612.5%Other
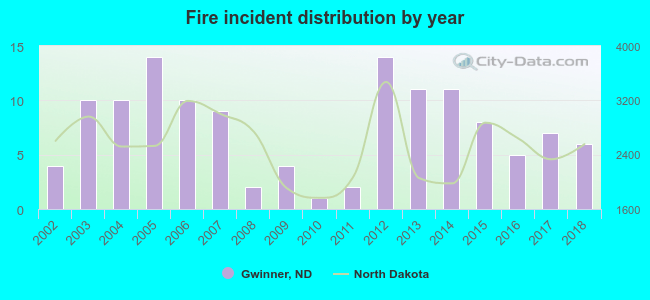 Based on the data from the years 2002 - 2018 the average number of fire incidents per year is 8. The highest number of reported fire incidents - 14 took place in 2005, and the least - 1 in 2010. The data has a growing trend.
 48.4% incidents where reported in the morning and 51.6% in the evening. The most fires (20.3%) took place on Friday, and the least (8.6%) on Sunday.
 According to the 128 fire incident reports from years 2002 - 2018 most fires (16.4%) took place during April, and the least (3.1%) in July.
 Out of all 170 cases reported during the years 2002 - 2018, the most belonged to the categories: Fire (75.3%), Severe Weather (7.6%), and Hazardous Condition (5.9%).
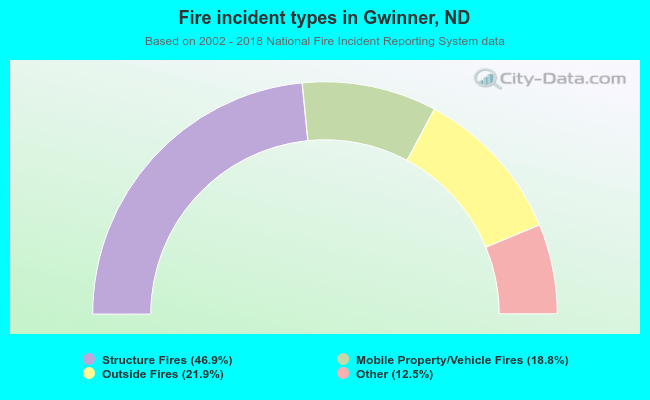 When looking into fire subcategories, the most incidents belonged to: Structure Fires (46.9%), and Outside Fires (21.9%).