| Fire incidents reported |
|---|
| Sreet name | Count |
|---|
| S AMOS RD | 8 | | HEDBERG RD | 6 | | K-4 HIGHWAY | 6 | | KING ST | 6 | | SMOKEY VALLEY RD | 6 | | 2440 30TH AVE | 4 | | 27TH AVE | 4 | | AMOS RD | 4 | | SHAWNEE RD | 4 | | SMOKY VALLEY RD | 4 | | SOLOMON RD | 4 | | SPRING ST | 4 | | 1000 AVE AVE | 2 | | 10512 E HEDBERG RD | 2 | | 1200 AVE | 2 | | 1200 AVE | 2 | | 1700 AVE | 2 | | 1800 AVE | 2 | | 2311 SMOKEY VALLEY RD | 2 | | 23RD AVE | 2 | | 2478 27TH AVE | 2 | | 24TH AVE | 2 | | 24TH AVENUE | 2 | | 2531 22ND AVE | 2 | | 2572 SMOKY VALLEY RD | 2 |
| | | Fire incidents reported |
|---|
| Sreet name | Count |
|---|
| 25TH AVE | 2 | | 2630 WELLS FARGO RD | 2 | | 2664 26TH AVE | 2 | | 2690 SMOKEY VALLEY RD | 2 | | 27TH & WHEAT RIDGE RD | 2 | | 2862 WHEATRIDGE RD | 2 | | 28TH AVE | 2 | | 29TH & WINCHESTER RD | 2 | | 2ND ST | 2 | | 509 MAPLE ST | 2 | | 6TH ST | 2 | | 700 MAPLE ST | 2 | | 7700 WOODWARD | 2 | | 7TH | 2 | | 8TH | 2 | | ASSARIA RD | 2 | | ASSARIA RD | 2 | | E HEDBERG RD | 2 | | E LAPSLEY RD | 2 | | FARRELLY | 2 | | GYPSUM AVE | 2 | | GYPSUM VALLEY RD | 2 | | HAWK ST | 2 | | HAWKES ST | 2 | | |
|
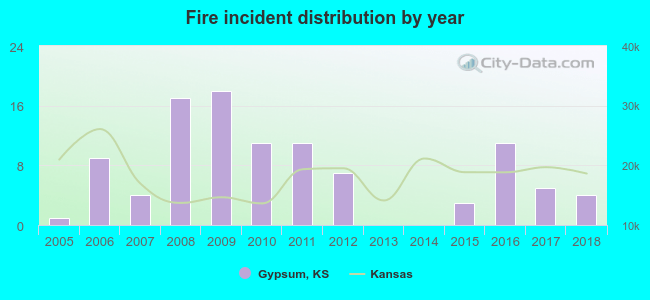 Based on the data from the years 2005 - 2018 the average number of fires per year is 7. The highest number of fires - 18 took place in 2009, and the least - 0 in 2013. The data has a growing trend.
 14.9% incidents where reported in the morning and 85.1% in the evening. The most fires (20.8%) took place on Wednesday, and the least (8.9%) on Tuesday.
 According to the 101 reports from years 2005 - 2018 most fires (21.8%) took place during March, and the least (1.0%) in September.
 Out of all 171 cases reported during the years 2005 - 2018, the most belonged to the categories: Fire (59.1%), Overpressure Rupture (26.9%), and Rescue & EMS (6.4%).
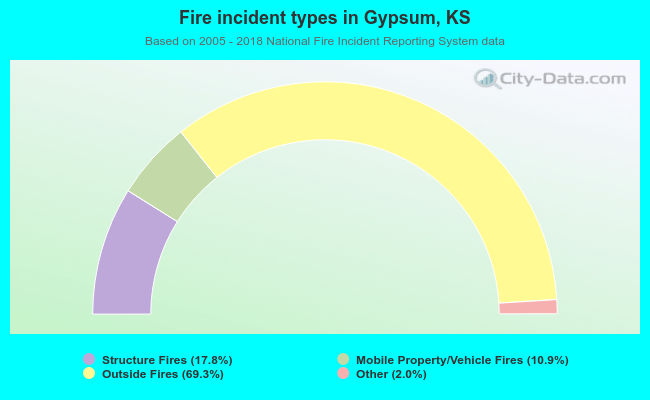 When looking into fire subcategories, the most incidents belonged to: Outside Fires (69.3%), and Structure Fires (17.8%).