| Fire incidents reported |
|---|
| Sreet name | Count |
|---|
| FOOTHILL RD | 14 | | HWY 30 | 6 | | POCAHONTAS RD | 6 | | SCHOOL HOUSE RD | 6 | | SOUTH ROCK CREEK LN | 6 | | AMY ST | 4 | | CHANDLER LANE | 4 | | CHANDLER LN | 4 | | COFFEY LN | 4 | | COLE STREET | 4 | | HWY 30 HWY | 4 | | INTERSTATE 84 FWY | 4 | | SCHOOLHOUSE RD | 4 | | WILCOX ST | 4 | | 1435 3RD STREET ST | 2 | | 2ND STREET | 2 | | 3RD ST | 2 | | 3RD ST | 2 | | 3RD STREET | 2 | | 45298 POCAHONTAS RD. LN | 2 | | 45667SLOUGH RD AVE | 2 | | 4TH ST | 2 | | 5TH ST | 2 | | 5TH STREET AVE | 2 | | 84 FWY | 2 |
| | | Fire incidents reported |
|---|
| Sreet name | Count |
|---|
| AMY | 2 | | AMY STREET AVE | 2 | | ANTHONY LAKE HWY | 2 | | ANTHONY LAKES HWY | 2 | | ANTHONY LAKES HWY | 2 | | ANTHONY LAKES RD | 2 | | AUBURN AVE BAKER CITY | 2 | | BIG MUDDY CREEK LN | 2 | | BIG MUDDY CREEK LN | 2 | | BIG MUDDY CREEK LN. LN | 2 | | BIRCH ST | 2 | | BIRCH STREET | 2 | | CAMPBELL AND 14TH | 2 | | CEMETARY LN | 2 | | CHANDLER LN. | 2 | | COFFEE LN | 2 | | COFFEE LN 2 MILES WEST OF I84 LN | 2 | | COLE ST | 2 | | CONOR RD | 2 | | CONRO RD | 2 | | CONRO RD. | 2 | | CONRO RD. RD | 2 | | COYOTE PEAK | 2 | | COYOTE PEAK FWY | 2 | | CULLEY LANE LN | 2 |
|
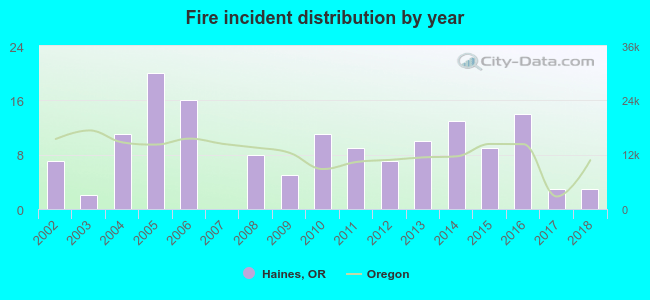 Based on the data from the years 2002 - 2018 the average number of fires per year is 9. The highest number of fire incidents - 20 took place in 2005, and the least - 0 in 2007. The data has a declining trend.
 32.4% incidents where reported in the morning and 67.6% in the evening. The most fires (18.9%) took place on Saturday, and the least (10.8%) on Wednesday.
 According to the 148 fire incident reports from years 2002 - 2018 most fires (17.6%) took place during July, and the least (3.4%) in May.
 Out of all 240 cases reported during the years 2002 - 2018, the most belonged to the categories: Fire (61.7%), Overpressure Rupture (20.4%), and Service Call (10.4%).
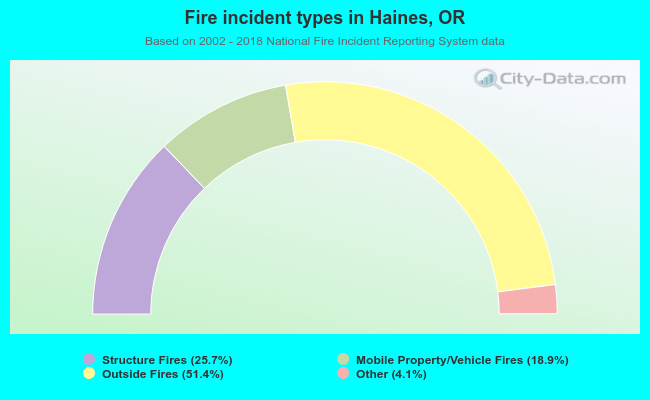 When looking into fire subcategories, the most incidents belonged to: Outside Fires (51.4%), and Structure Fires (25.7%).