Haleyville: Fire Incidents, Alabama (AL)
Where are fire incidents reported in Haleyville, AL
Something went wrong! Please refresh the page.
|
| |||||||||||||||||||||||||||||||||||||||||||||||||||||||||||||||||||||||||||||||||||||||||||||||||||||||||||||
2002 - 2018 National Fire Incident Reporting System (NFIRS) incidents
- Incident types reported to NFIRS in Haleyville, AL
- 71770.6%Fire
- 15114.9%Hazardous Condition
- 585.7%Good Intent Call
- 484.7%Rescue & EMS
- 333.2%False Alarm
- 70.7%Service Call
- Fire incident types reported to NFIRS in Haleyville, AL
- 30843.0%Outside Fires
- 29641.3%Structure Fires
- 7510.5%Mobile Property/Vehicle Fires
- 385.3%Other
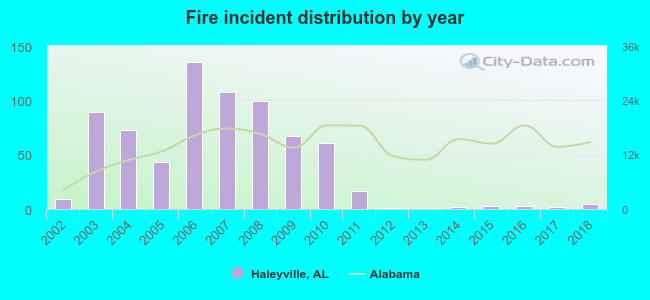 Based on the data from the years 2002 - 2018 the average number of fire incidents per year is 42. The highest number of fire incidents - 135 took place in 2006, and the least - 0 in 2013. The data has a declining trend.
 The median response time based on all reported fire incidents is 6 minutes. This is close to the state median value.
The median response time in Haleyville, AL compared to nearest cities:
(Note: Based on data for all years, including only cities with at least 500 fire incidents)
| Haleyville: | 6 minutes |
| Nauvoo: | 11 minutes |
| Russellville: | 5 minutes |
| Hamilton: | 8 minutes |
| Moulton: | 9 minutes |
| Jasper: | 9 minutes |
| Muscle Shoals: | 4 minutes |
| Fayette: | 6 minutes |
| Parrish: | 10 minutes |
 34.6% incidents where reported in the morning and 65.4% in the evening. The most fires (16.7%) took place on Saturday, and the least (12.1%) on Sunday.
 Based on the 717 fire incident reports from years 2002 - 2018 most fires (16.3%) took place during March, and the least (5.6%) in May.
 Out of all 1,016 cases reported during the years 2002 - 2018, the most belonged to the categories: Fire (70.6%), Rescue & EMS (14.9%), and Service Call (5.7%).
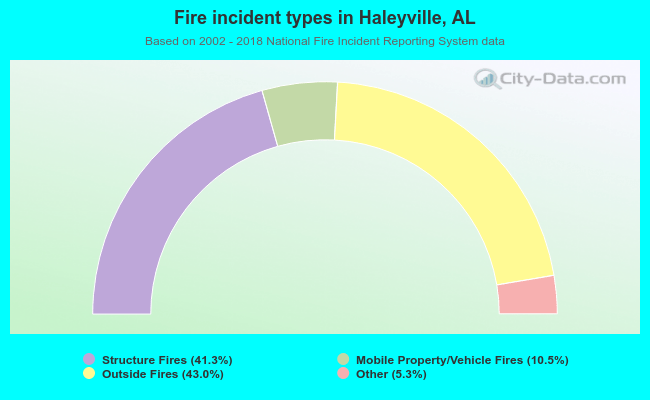 When looking into fire subcategories, the most reports belonged to: Outside Fires (43.0%), and Structure Fires (41.3%).