Halls: Fire Incidents, Tennessee (TN)
Where are fire incidents reported in Halls, TN
Something went wrong! Please refresh the page.
|
| |||||||||||||||||||||||||||||||||||||||||||||||||||||||||||||||||||||||||||||||||||||||||||||||||||||||||||||
| Other | 51 | |||||||||||||||||||||||||||||||||||||||||||||||||||||||||||||||||||||||||||||||||||||||||||||||||||||||||||||
2004 - 2018 National Fire Incident Reporting System (NFIRS) incidents
- Incident types reported to NFIRS in Halls, TN
- 45978.3%Fire
- 6410.9%Rescue & EMS
- 345.8%Hazardous Condition
- 152.6%Good Intent Call
- 81.4%Service Call
- 30.5%Overpressure Rupture
- 30.5%False Alarm
- Fire incident types reported to NFIRS in Halls, TN
- 22148.1%Outside Fires
- 18139.4%Structure Fires
- 418.9%Mobile Property/Vehicle Fires
- 163.5%Other
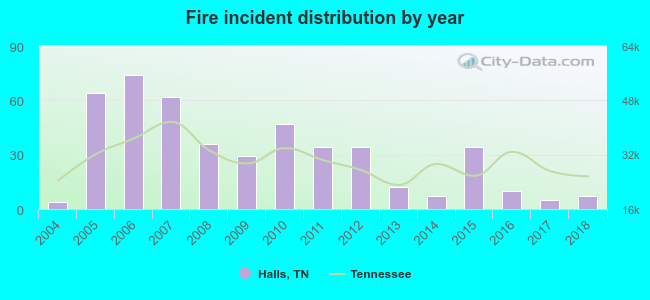 According to the data from the years 2004 - 2018 the average number of fires per year is 31. The highest number of reported fire incidents - 74 took place in 2006, and the least - 4 in 2004. The data has an increasing trend.
 31.8% incidents where reported in the morning and 68.2% in the evening. The most fires (15.9%) took place on Saturday, and the least (13.3%) on Friday.
 According to the 459 fires from years 2004 - 2018 most fires (11.5%) took place during January, and the least (5.2%) in September.
 Out of all 586 cases reported during the years 2004 - 2018, the most belonged to the categories: Fire (78.3%), Rescue & EMS (10.9%), and Hazardous Condition (5.8%).
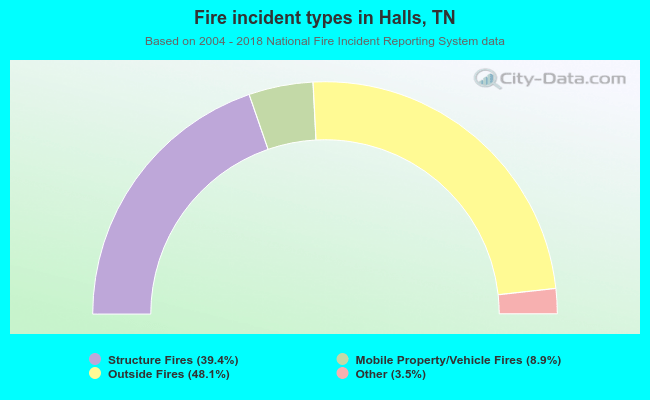 When looking into fire subcategories, the most incidents belonged to: Outside Fires (48.1%), and Structure Fires (39.4%).