Hamburg: Fire Incidents, New York (NY)
Where are fire incidents reported in Hamburg, NY
Something went wrong! Please refresh the page.
| Fire incidents reported | |
|---|---|
| Sreet name | Count |
| LAKE SHORE RD | 210 |
| MCKINLEY PW | 170 |
| SOUTHWESTERN BLVD | 136 |
| SOUTH PARK AV | 118 |
| SOUTHWESTERN BD | 114 |
| MCKINLEY PKY | 102 |
| SOUTH PARK AVE | 102 |
| CAMP RD | 100 |
| HOWARD RD | 92 |
| LAKE SHORE RD | 78 |
| CAMP RD | 74 |
| NEW YORK STATE TW | 62 |
| BOSTON STATE RD | 60 |
| MILESTRIP RD | 60 |
| BAYVIEW RD | 48 |
| ABBOTT RD | 44 |
| BAYVIEW RD | 42 |
| ROGERS RD | 42 |
| SOWLES RD | 42 |
| BIG TREE RD | 40 |
| PLEASANT AVE | 40 |
| CLOVERBANK RD | 38 |
| BIG TREE RD | 34 |
| CLARK ST | 34 |
| NEW YORK STATE THRUWAY | 34 |
| AMSDELL RD | 28 |
| ROGERS RD | 28 |
| MAIN ST | 26 |
| SOWLES RD | 26 |
| WATERVIEW PW | 26 |
| Other | 412 |
2002 - 2018 National Fire Incident Reporting System (NFIRS) incidents
- Incident types reported to NFIRS in Hamburg, NY
- 12,53854.7%Rescue & EMS
- 3,34214.6%Good Intent Call
- 2,46210.7%Fire
- 1,9828.6%False Alarm
- 1,7837.8%Hazardous Condition
- 6532.8%Service Call
- 960.4%Severe Weather
- 610.3%Special Incident
- Fire incident types reported to NFIRS in Hamburg, NY
- 1,40557.1%Structure Fires
- 50520.5%Outside Fires
- 29512.0%Mobile Property/Vehicle Fires
- 25710.4%Other
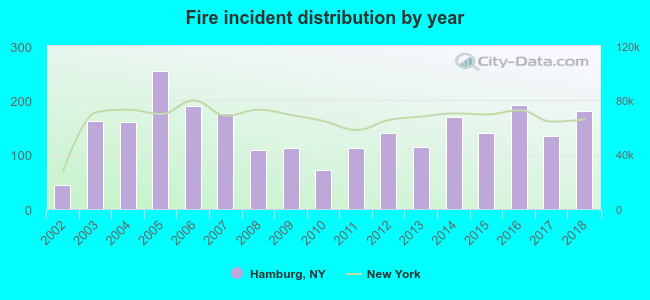 According to the data from the years 2002 - 2018 the average number of fire incidents per year is 145. The highest number of fires - 254 took place in 2005, and the least - 45 in 2002. The data has an increasing trend.
The average number of yearly fire incidents per 10k residents in Hamburg, NY compared to nearest cities:
(Note: Based on data for the last 3 years, including only cities with population 5,000 and above)
| Hamburg: | 177.0 |
| Boston: | 30.7 |
| Lackawanna: | 37.7 |
| West Seneca: | 37.2 |
| East Aurora: | 27.7 |
| Evans: | 3.5 |
| Elma: | 14.1 |
| Buffalo: | 16.1 |
| Cheektowaga: | 32.4 |
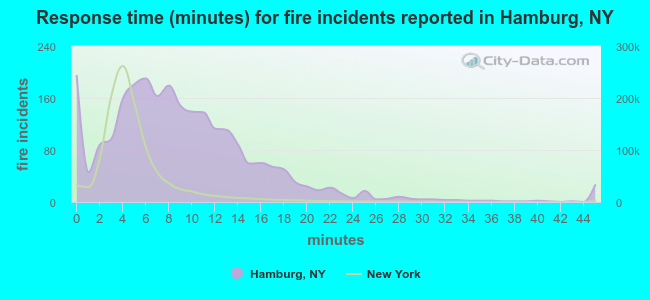 The median response time based on all reported fire incidents is 8 minutes. This is higher compared to the New York median value.
The median response time in Hamburg, NY compared to nearest cities:
(Note: Based on data for all years, including only cities with at least 500 fire incidents)
| Hamburg: | 8 minutes |
| Blasdell: | 9 minutes |
| Orchard Park: | 5 minutes |
| Lackawanna: | 3 minutes |
| West Seneca: | 5 minutes |
| Angola: | 4 minutes |
| Buffalo: | 3 minutes |
| Cheektowaga: | 4 minutes |
| Depew: | 3 minutes |
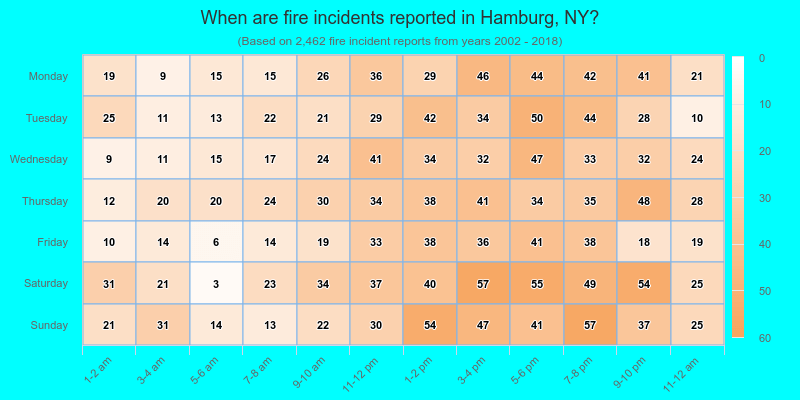
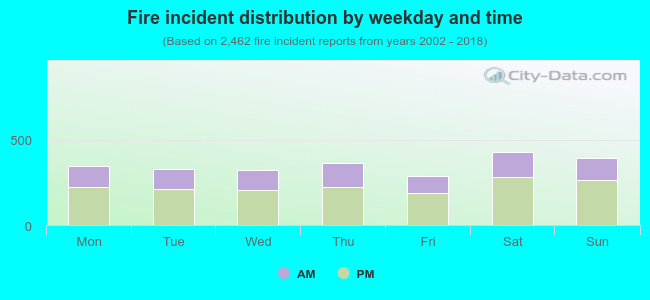 35.5% incidents where reported in the morning and 64.5% in the evening. The most fires (17.4%) took place on Saturday, and the least (11.6%) on Friday.
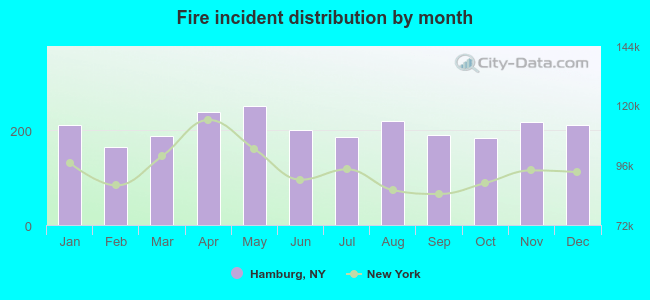 Based on the 2,462 fires from years 2002 - 2018 most fires (10.2%) took place during May, and the least (6.7%) in February.
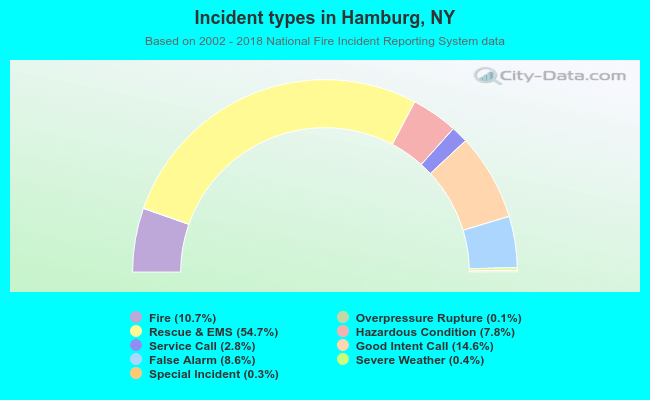 Out of all 22,929 cases reported during the years 2002 - 2018, the most belonged to the categories: Rescue & EMS (54.7%), Good Intent Call (14.6%), and Fire (10.7%).
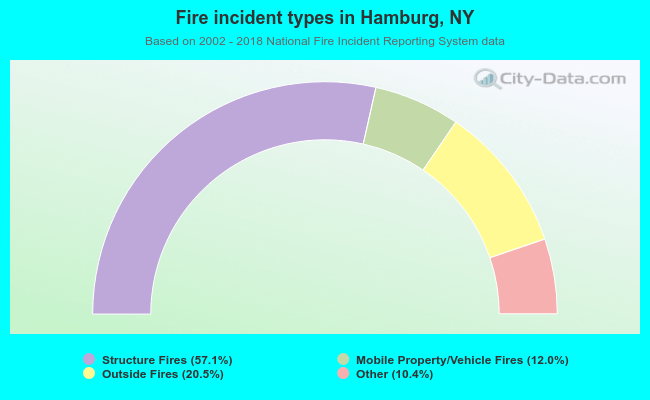 When looking into fire subcategories, the most incidents belonged to: Structure Fires (57.1%), and Outside Fires (20.5%).