Hampden: Fire Incidents, Massachusetts (MA)
Where are fire incidents reported in Hampden, MA
Something went wrong! Please refresh the page.
|
| |||||||||||||||||||||||||||||||||||||||||||||||||||||||||||||||||||||||||||||||||||||||||||||||||||||||||||||
2002 - 2018 National Fire Incident Reporting System (NFIRS) incidents
- Incident types reported to NFIRS in Hampden, MA
- 68544.8%Rescue & EMS
- 39926.1%Fire
- 15410.1%False Alarm
- 1519.9%Hazardous Condition
- 865.6%Service Call
- 452.9%Good Intent Call
- 40.3%Overpressure Rupture
- 30.2%Special Incident
- Fire incident types reported to NFIRS in Hampden, MA
- 27368.4%Structure Fires
- 10025.1%Outside Fires
- 153.8%Mobile Property/Vehicle Fires
- 112.8%Other
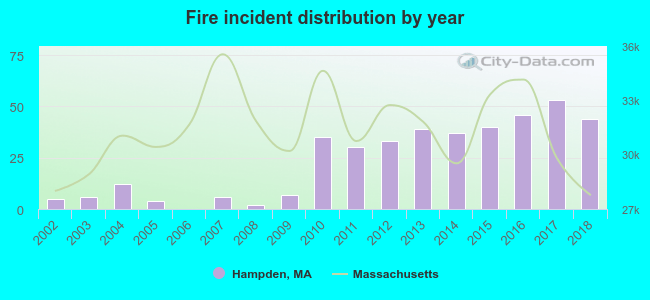 Based on the data from the years 2002 - 2018 the average number of fire incidents per year is 23. The highest number of reported fires - 53 took place in 2017, and the least - 0 in 2006. The data has a growing trend.
The average number of yearly fire incidents per 10k residents in Hampden, MA compared to nearest cities:
(Note: Based on data for the last 3 years, including only cities with population 5,000 and above)
| Hampden: | 92.8 |
| East Longmeadow: | 30.1 |
| Monson: | 31.2 |
| Springfield: | 37.6 |
| Longmeadow: | 20.9 |
| Ludlow: | 30.6 |
| Chicopee: | 33.0 |
| Agawam: | 26.7 |
| West Springfield: | 30.4 |

 30.8% incidents where reported in the morning and 69.2% in the evening. The most fires (18.8%) took place on Saturday, and the least (9.3%) on Thursday.
 Based on the 399 fire incident reports from years 2002 - 2018 most fires (14.5%) took place during April, and the least (5.0%) in October.
 Out of all 1,528 cases reported during the years 2002 - 2018, the most belonged to the categories: Rescue & EMS (44.8%), Fire (26.1%), and False Alarm (10.1%).
 When looking into fire subcategories, the most reports belonged to: Structure Fires (68.4%), and Outside Fires (25.1%).