Hampstead: Fire Incidents, New Hampshire (NH)
Where are fire incidents reported in Hampstead, NH
Something went wrong! Please refresh the page.
|
| |||||||||||||||||||||||||||||||||||||||||||||||||||||||||||||||||||||||||||||||||||||||||||||||||||||||||||||
2002 - 2018 National Fire Incident Reporting System (NFIRS) incidents
- Incident types reported to NFIRS in Hampstead, NH
- 2,97553.2%Rescue & EMS
- 66912.0%Hazardous Condition
- 66812.0%Service Call
- 62811.2%False Alarm
- 3426.1%Good Intent Call
- 2885.2%Fire
- 80.1%Overpressure Rupture
- 70.1%Severe Weather
- Fire incident types reported to NFIRS in Hampstead, NH
- 16256.3%Structure Fires
- 8529.5%Outside Fires
- 2910.1%Mobile Property/Vehicle Fires
- 124.2%Other
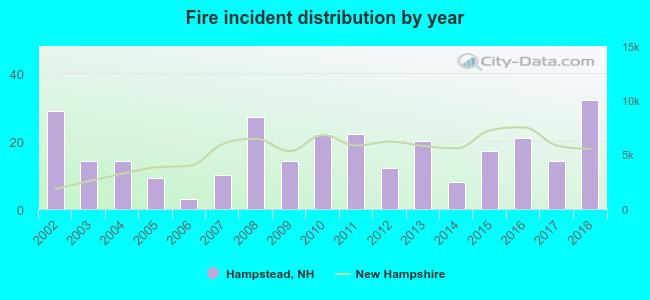 Based on the data from the years 2002 - 2018 the average number of fire incidents per year is 17. The highest number of reported fire incidents - 32 took place in 2018, and the least - 3 in 2006. The data has a rising trend.
The average number of yearly fire incidents per 10k residents in Hampstead, NH compared to nearest cities:
(Note: Based on data for the last 3 years, including only cities with population 5,000 and above)
| Hampstead: | 26.2 |
| Atkinson: | 17.3 |
| Sandown: | 25.1 |
| Plaistow: | 47.3 |
| Kingston: | 52.6 |
| Salem: | 38.0 |
| Derry: | 46.6 |
| Windham: | 29.7 |
| Londonderry: | 72.8 |
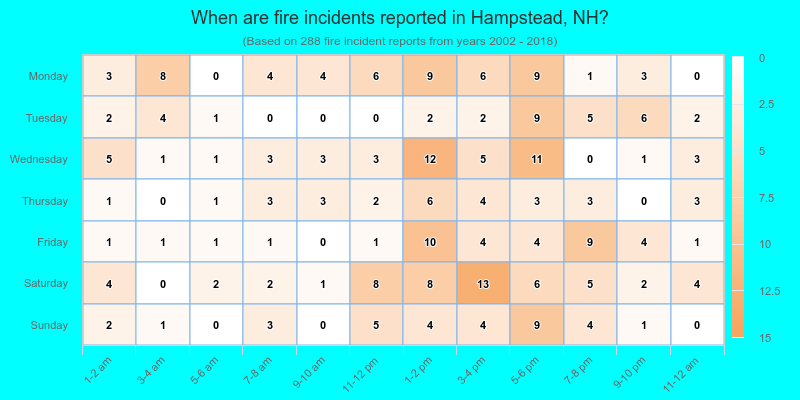
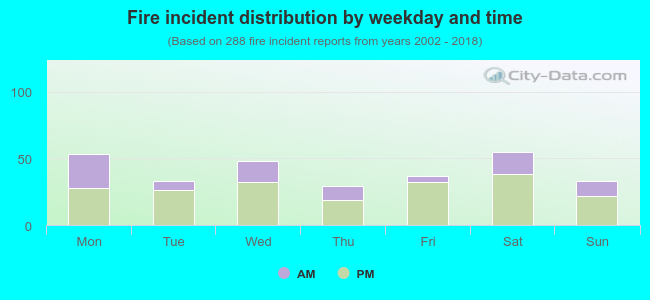 31.6% incidents where reported in the morning and 68.4% in the evening. The most fires (19.1%) took place on Saturday, and the least (10.1%) on Thursday.
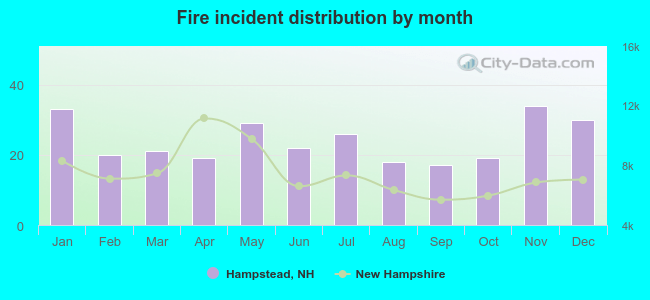 According to the 288 fires from years 2002 - 2018 most fires (11.8%) took place during November, and the least (5.9%) in September.
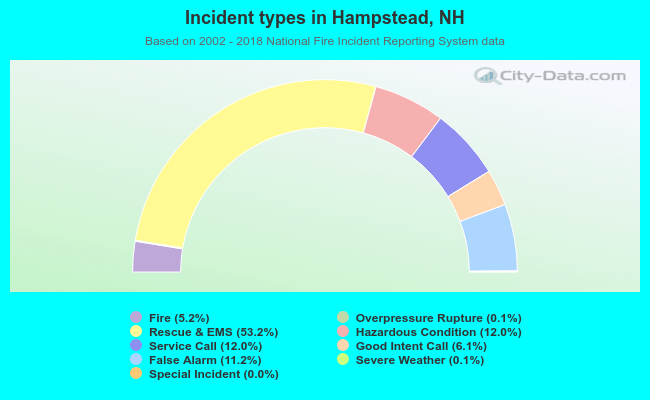 Out of all 5,587 cases reported during the years 2002 - 2018, the most belonged to the categories: Rescue & EMS (53.2%), Hazardous Condition (12.0%), and Service Call (12.0%).
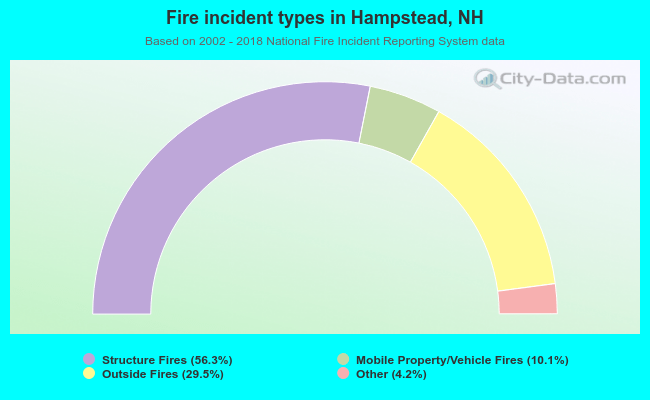 When looking into fire subcategories, the most incidents belonged to: Structure Fires (56.3%), and Outside Fires (29.5%).