Hampton Falls: Fire Incidents, New Hampshire (NH)
Where are fire incidents reported in Hampton Falls, NH
Something went wrong! Please refresh the page.
|
| |||||||||||||||||||||||||||||||||||||||||||||||||||||||||||||||||||||||||||||||||||||||||||||||||||||||||||||
2002 - 2018 National Fire Incident Reporting System (NFIRS) incidents
- Incident types reported to NFIRS in Hampton Falls, NH
- 63547.4%Rescue & EMS
- 22116.5%Hazardous Condition
- 16212.1%Fire
- 1178.7%False Alarm
- 1057.8%Service Call
- 846.3%Good Intent Call
- 120.9%Severe Weather
- 20.1%Overpressure Rupture
- 20.1%Special Incident
- Fire incident types reported to NFIRS in Hampton Falls, NH
- 8753.7%Structure Fires
- 3521.6%Outside Fires
- 2817.3%Mobile Property/Vehicle Fires
- 127.4%Other
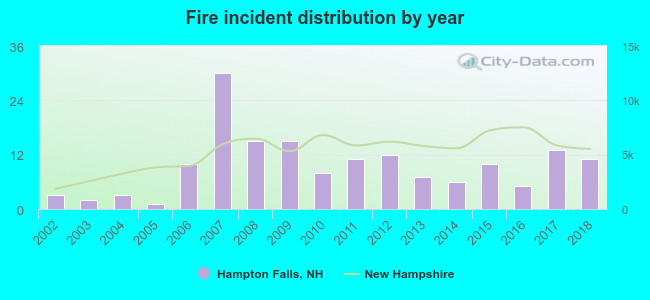 Based on the data from the years 2002 - 2018 the average number of fire incidents per year is 10. The highest number of reported fire incidents - 30 took place in 2007, and the least - 1 in 2005. The data has a rising trend.
 32.1% incidents where reported in the morning and 67.9% in the evening. The most fires (18.5%) took place on Tuesday, and the least (9.3%) on Saturday.
 According to the 162 fires from years 2002 - 2018 most fires (12.3%) took place during October, and the least (4.9%) in August.
 Out of all 1,340 cases reported during the years 2002 - 2018, the most belonged to the categories: Rescue & EMS (47.4%), Hazardous Condition (16.5%), and Fire (12.1%).
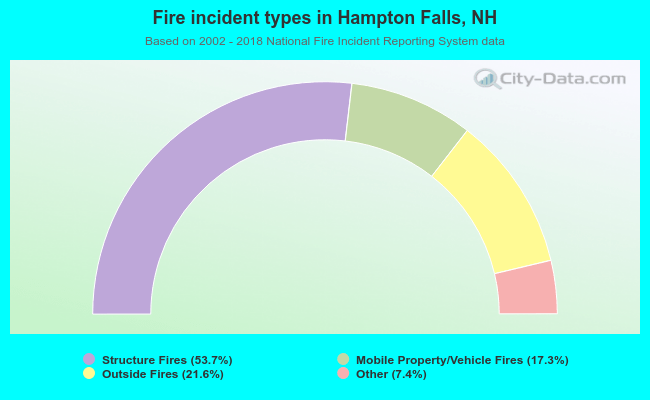 When looking into fire subcategories, the most incidents belonged to: Structure Fires (53.7%), and Outside Fires (21.6%).