Hampton: Fire Incidents, Illinois (IL)
Where are fire incidents reported in Hampton, IL
Something went wrong! Please refresh the page.
|
| |||||||||||||||||||||||||||||||||||||||||||||||||||||||||||||||||||||||||||||||||||||||||||||||||||||||||||||
2002 - 2018 National Fire Incident Reporting System (NFIRS) incidents
- Incident types reported to NFIRS in Hampton, IL
- 56562.6%Rescue & EMS
- 12914.3%Fire
- 849.3%Hazardous Condition
- 798.8%Good Intent Call
- 212.3%Service Call
- 192.1%False Alarm
- 40.4%Severe Weather
- 10.1%Special Incident
- Fire incident types reported to NFIRS in Hampton, IL
- 5542.6%Structure Fires
- 4736.4%Outside Fires
- 1410.9%Mobile Property/Vehicle Fires
- 1310.1%Other
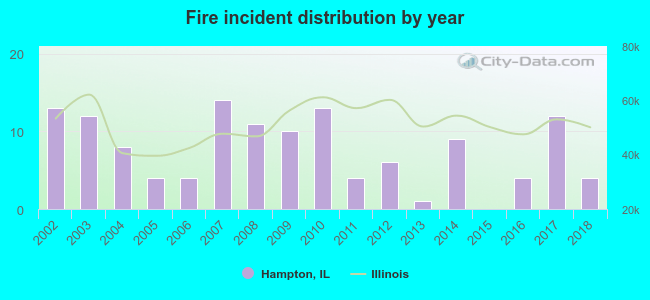 Based on the data from the years 2002 - 2018 the average number of fire incidents per year is 8. The highest number of fire incidents - 14 took place in 2007, and the least - 0 in 2015. The data has a decreasing trend.
 30.2% incidents where reported in the morning and 69.8% in the evening. The most fires (16.3%) took place on Wednesday, and the least (12.4%) on Thursday.
 Based on the 129 fires from years 2002 - 2018 most fires (21.7%) took place during June, and the least (0.8%) in May.
 Out of all 902 cases reported during the years 2002 - 2018, the most belonged to the categories: Overpressure Rupture (62.6%), Fire (14.3%), and Rescue & EMS (9.3%).
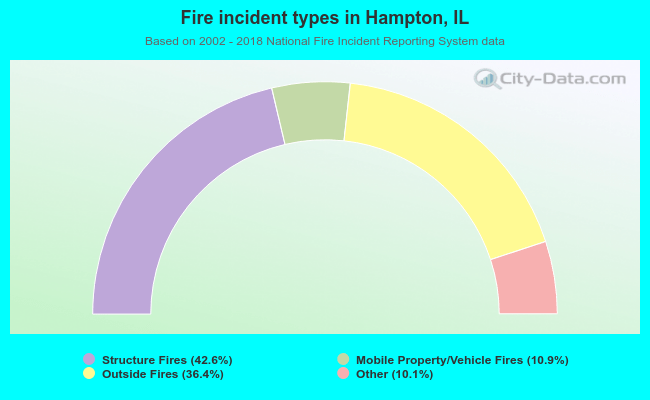 When looking into fire subcategories, the most reports belonged to: Structure Fires (42.6%), and Outside Fires (36.4%).