| Fire incidents reported |
|---|
| Sreet name | Count |
|---|
| PERRYVILLE RD | 42 | | MAIN ST | 26 | | FRONTAGE RD | 24 | | RT 78 | 24 | | RT 173 | 18 | | RT. 78 | 18 | | CHARLESTOWN RD | 16 | | NORMA RD | 12 | | HACKETT RD | 10 | | INTERSTATE 78 | 10 | | IRON BRIDGE RD | 10 | | SUNSET TER | 10 | | DRIFTWAY | 8 | | FINN RD | 8 | | GRAND ST | 8 | | MUSCONETCONG RIVER RD | 8 | | RT. 173 | 8 | | RTE 31 | 8 | | VAN SYCKELS RD | 8 | | COUNTRY ACRE DR | 6 | | COUNTY RD 625 | 6 | | DUTCH HILL RD | 6 | | JUNCTION RD | 6 | | MAIN ST | 6 | | MAIN ST.-JUTLAND | 6 |
| | | Fire incidents reported |
|---|
| Sreet name | Count |
|---|
| MUSCONGETCONG RIVER | 6 | | NEW ST | 6 | | NEW STREET | 6 | | POLKTOWN RD | 6 | | ROBIN HILL RD | 6 | | SPRUCE HILLS DR | 6 | | STONEBRIDGE RD | 6 | | UPPER SKILLMAN ST | 6 | | WOLF FARM RD | 6 | | BAPTIST CHURCH | 4 | | CHARLESTOWN ROAD | 4 | | COUNTY RD. 625 | 4 | | COUNTY RD. 635 | 4 | | HENDERSON RD | 4 | | JOHNSON AVE | 4 | | JOHNSON AVE. | 4 | | MAIN STREET | 4 | | MOUNTAIN VIEW RD | 4 | | MUSCONETCONG | 4 | | ROUTE 173 | 4 | | SOUTH ST | 4 | | THOMAS ROAD | 4 | | VAN SYCKLES RD | 4 | | 149 RT 521 | 2 | | |
|
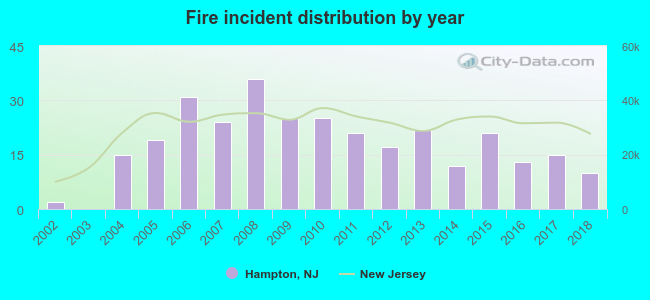 According to the data from the years 2002 - 2018 the average number of fires per year is 18. The highest number of reported fire incidents - 36 took place in 2008, and the least - 0 in 2003. The data has a rising trend.
 29.5% incidents where reported in the morning and 70.5% in the evening. The most fires (16.6%) took place on Sunday, and the least (11.7%) on Thursday.
 According to the 308 fires from years 2002 - 2018 most fires (11.4%) took place during February, and the least (4.9%) in May.
 Out of all 1,022 cases reported during the years 2002 - 2018, the most belonged to the categories: Fire (30.1%), Rescue & EMS (23.1%), and Overpressure Rupture (19.7%).
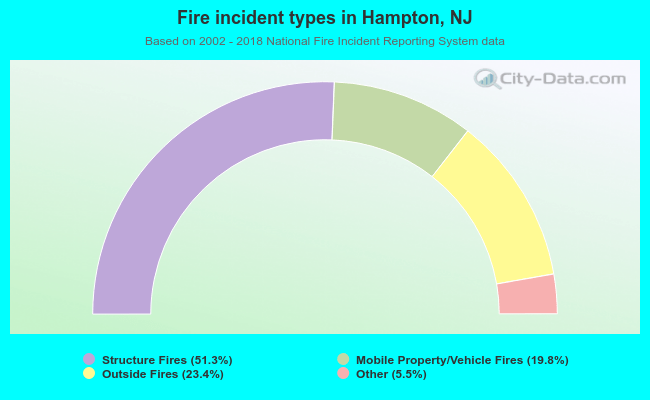 When looking into fire subcategories, the most reports belonged to: Structure Fires (51.3%), and Outside Fires (23.4%).