| Fire incidents reported |
|---|
| Sreet name | Count |
|---|
| 31/MAIN STREET | 25 | | AL HWY 91 | 24 | | COUNTY ROAD 8 | 17 | | ASHWANDER ST | 15 | | COMMERCIAL ST | 15 | | MAIN ST | 15 | | HWY 91 | 14 | | CO RD 655 | 13 | | 12499 CO RD 747 | 10 | | 581 COUNTY ROAD 46 | 10 | | 747 RD | 10 | | JULIA LN | 10 | | SELF AVE | 10 | | COUNTY ROAD 649 | 9 | | 1334 CO RD 651 | 8 | | COUNTY ROAD 655 | 8 | | 0145 COUNTY ROAD 38 | 5 | | 1117 COUNTY ROAD 46 | 5 | | 1210 COUNTY ROAD 649 | 5 | | 12209 CO RD 747 | 5 | | 1249 CO RD 747 | 5 | | 12550 CO RD 747 | 5 | | 1334 COUNTY ROAD 651 | 5 | | 134 CO RD 653 | 5 | | 135 COUNTY ROAD 46 | 5 |
| | | Fire incidents reported |
|---|
| Sreet name | Count |
|---|
| 1400 COUNTY ROAD 768 | 5 | | 1405 CO RD 1643 | 5 | | 1456 COUNTY ROAD 798 | 5 | | 1467 COUNTY ROAD 641 | 5 | | 1491 CO RD 641 | 5 | | 1500 CO RD 649 | 5 | | 1516 CO RD 641 | 5 | | 1583 CO RD 641 | 5 | | 165 COUNTY ROAD 659 | 5 | | 1695 COUNTY ROAD 649 | 5 | | 171 C.R. 248 | 5 | | 180 C.R. 73 | 5 | | 1854 CO RD 216 | 5 | | 1997 COUNTY ROAD 781 | 5 | | 215 CO RD 762 | 5 | | 22 CO RD 652 | 5 | | 2340 CO RD 643 | 5 | | 2406 CO RD 649 | 5 | | 2445 HIWAY 69 SOUTH | 5 | | 2493 CO RD 781 | 5 | | 2548 CO RD 740 | 5 | | 26 RD | 5 | | 2700 CO RD 649 | 5 | | 2835 COLONY DRIVE | 5 | | |
|
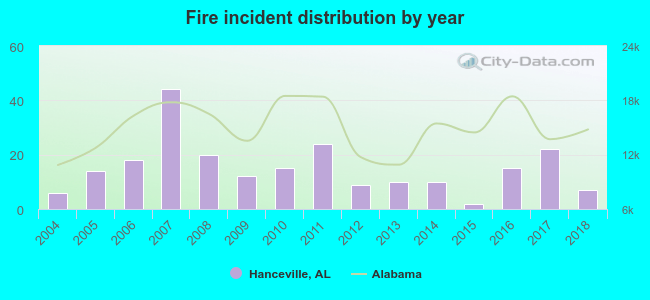 According to the data from the years 2004 - 2018 the average number of fire incidents per year is 15. The highest number of fires - 44 took place in 2007, and the least - 2 in 2015. The data has an increasing trend.
 30.7% incidents where reported in the morning and 69.3% in the evening. The most fires (19.3%) took place on Monday, and the least (7.0%) on Tuesday.
 Based on the 228 fires from years 2004 - 2018 most fires (16.2%) took place during January, and the least (4.8%) in September.
 Out of all 437 cases reported during the years 2004 - 2018, the most belonged to the categories: Fire (52.2%), Overpressure Rupture (19.2%), and Rescue & EMS (11.9%).
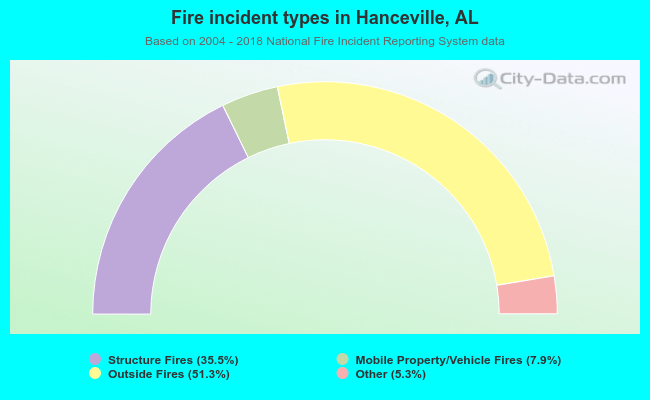 When looking into fire subcategories, the most incidents belonged to: Outside Fires (51.3%), and Structure Fires (35.5%).