| Fire incidents reported |
|---|
| Sreet name | Count |
|---|
| SALEM HANCOCKS BRIDGE RD | 16 | | HOGATE BLVD | 10 | | BEASLEY NECK RD | 8 | | MASKELLS MILL RD | 8 | | NEW BRIDGE RD | 8 | | POPLAR ST | 8 | | ALLOWAY CREEK NECK RD | 6 | | FORT ELFSBERG RD | 6 | | LOCUST ISLAND RD | 6 | | MAIN CANTON ST | 6 | | MAIN ST | 6 | | ROBINSON RD | 6 | | BUCKHORN RD | 4 | | FORT ELFSBURG RD | 4 | | JERICHO RD | 4 | | MONEY ISLAND RD | 4 | | QUINTON HANCOCKS BRIDGE RD | 4 | | QUINTON-HANCOCKS BRIDGE RD | 4 | | RT 49 | 4 | | SMICK RD | 4 | | STOW NECK RD | 4 | | WALNUT ST | 4 | | ALLOWAY ALDINE ROAD | 2 | | AMWELLBERRY RD | 2 | | BURDEN HILL RD | 2 |
| | | Fire incidents reported |
|---|
| Sreet name | Count |
|---|
| BUTTONWOOD AVE | 2 | | CANTON-HARMERSVILLE RD | 2 | | CAUSEWAY & STOW RD | 2 | | COHANSEY ROAD | 2 | | EAST AVE | 2 | | FROG OCEAN RD | 2 | | FRONT ST | 2 | | HAGERSVILLE RD | 2 | | HAMERSVILLE CANTON RD | 2 | | HAMERSVILLE PECKS CORNER RD | 2 | | HARMERSVILLE CANTON RD | 2 | | HOSPITAL RD | 2 | | LONG BRIDGE RD | 2 | | MASKELL MILL RD | 2 | | MASON POINT RD | 2 | | MILL POND RD | 2 | | NEW RD | 2 | | OLD KINGS HWY | 2 | | PECKS CORNER COHANSEY RD | 2 | | QUINTON HANCOCK BRIDGE RD | 2 | | RIVERVIEW DR | 2 | | ROBINSON ST | 2 | | SALEM-FORT ELFSBORG RD | 2 | | SALEM-QUINTON RD | 2 | | |
|
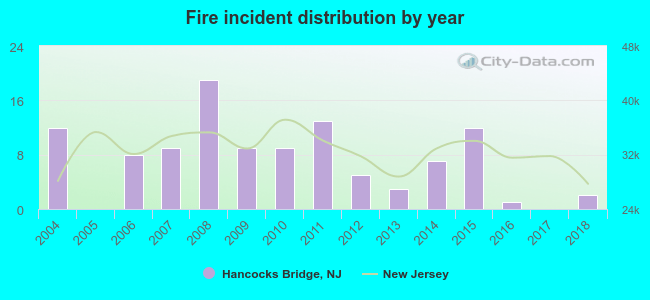 According to the data from the years 2004 - 2018 the average number of fires per year is 7. The highest number of reported fire incidents - 19 took place in 2008, and the least - 0 in 2005. The data has a declining trend.
 28.4% incidents where reported in the morning and 71.6% in the evening. The most fires (22.9%) took place on Thursday, and the least (8.3%) on Friday.
 According to the 109 fires from years 2004 - 2018 most fires (15.6%) took place during April, and the least (3.7%) in May.
 Out of all 177 cases reported during the years 2004 - 2018, the most belonged to the categories: Fire (61.6%), Rescue & EMS (22.6%), and Overpressure Rupture (5.6%).
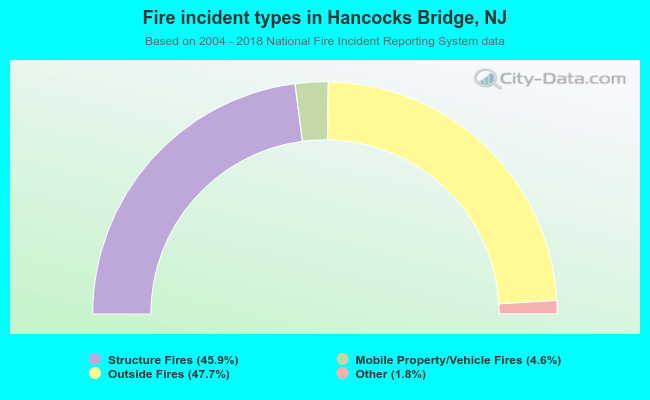 When looking into fire subcategories, the most reports belonged to: Outside Fires (47.7%), and Structure Fires (45.9%).