| Fire incidents reported |
|---|
| Sreet name | Count |
|---|
| CO RD 1 | 6 | | DAKOTA MAGIC CASINO | 6 | | 162ND AVE 99TH ST SE | 4 | | 16742 96TH ST SE | 4 | | 9205 167TH AVE SE | 4 | | 9230 CO RD 1 | 4 | | 95TH ST SE | 4 | | CASINO | 4 | | INTERSTATE 29 | 4 | | .5MILE EAST I29 .5MI | 2 | | 1 12 MILES NW OF HANKINSON | 2 | | 1 ST AVE NE | 2 | | 1/2 MILE WEST OF TOWN | 2 | | 10087 173 AVE SE | 2 | | 101 ST SE | 2 | | 10120 161 ST ST SE | 2 | | 10120 161ST AVE SE | 2 | | 10120 161ST ST SE | 2 | | 101ST ST SE | 2 | | 1620 99 ST S | 2 | | 16245 94TH ST SE | 2 | | 16290 91ST STREET SE | 2 | | 162ND AVE SE 99TH ST SE | 2 | | 16325 HWY 11 | 2 | | 16470 92ND ST SE | 2 |
| | | Fire incidents reported |
|---|
| Sreet name | Count |
|---|
| 165 AVE SE | 2 | | 16615 COUNTY ROAD 1 | 2 | | 16685 101 ST SE | 2 | | 167TH AVE SE | 2 | | 16888 88TH ST SE | 2 | | 169TH AVE 93RD ST SE | 2 | | 169TH AVE 96 ST SE | 2 | | 17275 95TH ST SE | 2 | | 2 | 2 | | 2 MILES EAST 1 MILES NORTH | 2 | | 21 E | 2 | | 3 MI N/ 1/4 MI E OF HWY 1 | 2 | | 301 4TH ST NE | 2 | | 3073 RD ST SW | 2 | | 308 2ND ST | 2 | | 310 2ND AVE | 2 | | 315 N. MAIN | 2 | | 323 2ND AVE SW | 2 | | 3RD ST APT 3 | 2 | | 4 MILES W HANKINSON ON HWY 11 | 2 | | 401 MAIN AVE SOUTH | 2 | | 406 3RD AVE SW | 2 | | 407 3RD AVE SW | 2 | | 411 2ND ST. SW | 2 | | |
|
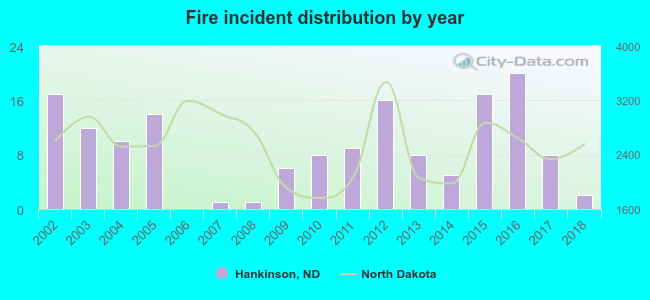 Based on the data from the years 2002 - 2018 the average number of fire incidents per year is 9. The highest number of reported fire incidents - 20 took place in 2016, and the least - 0 in 2006. The data has a dropping trend.
 33.8% incidents where reported in the morning and 66.2% in the evening. The most fires (22.7%) took place on Monday, and the least (7.1%) on Thursday.
 According to the 154 fire incident reports from years 2002 - 2018 most fires (20.8%) took place during April, and the least (4.5%) in February.
 Out of all 311 cases reported during the years 2002 - 2018, the most belonged to the categories: Fire (49.5%), Severe Weather (23.8%), and Overpressure Rupture (11.6%).
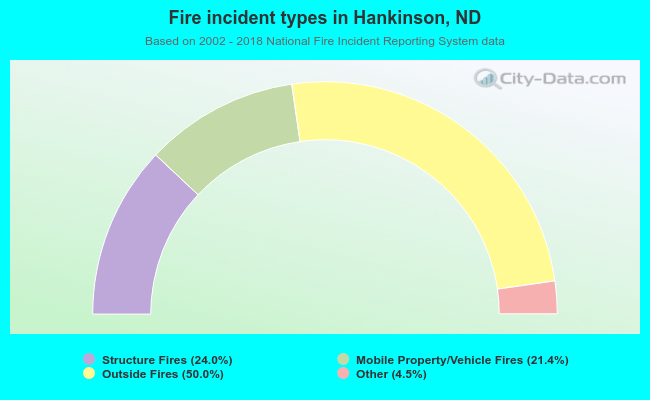 When looking into fire subcategories, the most incidents belonged to: Outside Fires (50.0%), and Structure Fires (24.0%).